
Current Information

Allegheny County Continuum of Care (CoC) is the network of services and stakeholders engaged in making homelessness rare, brief and non-recurring. Allegheny County CoC includes all of Allegheny County, the City of Pittsburgh, the City of McKeesport and the Municipality of Penn Hills. 

How the Continuum of Care Works

Homeless Advisory Board

The Homeless Advisory Board (HAB) is the working board of the Allegheny County CoC. Utilizing the expertise of its members, the HAB is responsible for planning, coordinating and operating a system within Allegheny County that meets the needs of individuals and families experiencing homelessness. Members of the HAB represent individuals who are homeless/formerly homeless, service agencies, planning and advocacy bodies, and funders.

HAB Committees

Five standing committees support the work of the HAB to supply advisory guidance and carry out its responsibilities. Ad hoc committees carry out special initiatives that focused efforts can best accomplish. Each HAB committee has two co-chairs, one representing the CoC-at-large and one HAB member. Co-chairs are responsible for setting the direction and agenda for the committee in accordance with HAB priorities and ensuring the correct membership mix is available for committee work.

The Role of the Allegheny County Department of Human Services

Delegated by the HAB, the Allegheny County Department of Human Services (DHS) serves as the Infrastructure Organization and manages day-to-day administrative and operational responsibilities. In this role, DHS receives CoC funding and administers it to service providers. DHS also provides programmatic and fiscal oversight; operates and maintains both the Coordinated Entry System (through Allegheny Link) and the Homelessness Management Information System; monitors performance; provides data, research and reports; and staffs HAB meetings and initiatives.

Governance Charter

The  Allegheny County CoC Governance Charter (PDF, 637KB) summarizes the responsibilities and authorities for operation and governance of the Allegheny County CoC under the Homeless Emergency Assistance and Rapid Transition to Housing Act (HEARTH Act).

Membership

Membership in the Allegheny County CoC is open to any individual interested in contributing to and productively shaping the delivery of homeless services. Continuum of Care members must annually attend at least one recognized meeting of the CoC (which includes CoC meetings or HAB committee meetings) and provide basic contact information.

Any member of the CoC can serve on a HAB committee. Every HAB committee has one co-chair who is a CoC member.

Each November, the HAB invites CoC members to join the HAB. Interested individuals may complete a nomination form for themselves or another person. The HAB Executive Committee first screens the nominations, and then the full HAB votes on the slate of proposed members at the subsequent January meeting.

To become a CoC member, please contact Hilary Scherer at  412-350-4938

Community Strategic Planning Process 

In late 2024, DHS and the HAB launched a planning process to develop a Strategic Improvement Plan to guide and strengthen the community’s homelessness response system. Between October 2024 and November 2025, more than 200 individuals contributed to this planning process through focus groups, interviews, site visits, meetings with many different organizations, input sessions, frontline listening sessions, committee and subcommittee meetings, and a survey.

These perspectives, combined with quantitative system data and national best practices, are shaping the priorities and strategies for the plan. The resulting five-year Strategic Improvement Plan (2026-2030) aims to prevent and end homelessness by (a) building upon current strengths within Allegheny County’s homelessness response system and (b) identifying and prioritizing the most important improvement opportunities.

The Strategic Improvement Plan to Address Homelessness in Allegheny County (PDF, 12MB) reflects the final plan adopted by the HAB.

Continuum of Care Documents

Questions or Feedback?

We welcome your questions and suggestions. To share feedback, you can reach us at DHSResearch@alleghenycounty.us. If you’d like to stay informed, consider signing up for our newsletter. To learn how to use DHS data in your research, please visit our Requesting Data page. Thank you for your time and interest. Your engagement helps shape and improve how we share data that matters.

Web Accessibility Statement

If you encounter any accessibility issues, have difficulty accessing any digital content, or require information presented on a website in an alternate format, please contact the ADA Coordinator or submit a concern through the Accessibility on Allegheny County-owned Websites form.
Current information

The Street Stabilization Team (SST), a new intervention launched by the Allegheny County Department of Human Services (ACDHS) in July 2026, is designed to address the difficulty faced by healthcare systems and publicly funded programs supporting people who demonstrate profound disability and/or high vulnerability and who are chronically disengaged from clinic-based care due to the severity of psychiatric symptoms and/or substance use disorder (SUD). The intervention aims to serve 20–30 of the County’s most vulnerable unhoused residents.

A shared mission guides the work of SST staff from ACDHS, University of Pittsburgh Medical Center (UPMC) and Allegheny Health Network (AHN):

To improve complex care coordination for individuals with multi-system needs, frequent crisis encounters and increased risk of adverse outcomes and create an interconnected, trauma informed response, in which individuals with complex needs receive timely and comprehensive care, minimizing crisis events and ensuring equitable access to essential services.


About SST

What services does SST offer?

Participants in the SST program receive a comprehensive blend of behavioral health, medical and social supports delivered by a coordinated multidisciplinary team. The team conducts mobile diagnostic assessments and facilitates communication with and access to medical and behavioral health facilities and providers. Staff also offer health education and medication management and ensures coordinated risk assessment and crisis response.

Service Eligibility

In order to be eligible for the SST program, a person must:

  • Be an Allegheny County resident, age 18 and older.
  • Be currently unhoused/experiencing street homelessness. 
  • Demonstrate severe psychiatric symptoms related to mental health or substance use issues. 
  • Be unwilling or unable to engage in traditional services due to severity of symptoms.
  • Be assessed as highly vulnerable based on a street assessment and/or risk model. 

How do SST referrals work?

Because SST-eligible clients are managing severe and unmet behavioral health needs and are routinely disengaged from human services programs, no single referral process can be expected to identify all eligible individuals; rather, SST referrals are made through two channels: provider referrals and data-driven referrals. 

Provider Referrals

Provider referrals are a critical entry point into the SST program and come from the following sources: 

  • City of Pittsburgh Office of Community Health and Safety providers
  • resolve Crisis Center 
  • Street Medicine teams
  • Street Outreach teams 
  • Alternative Response Team (A-Team) 
  • Complex case meetings for incarcerated individuals 

Data-Driven Referrals 

Data-driven referrals use a data-driven model to create a referral list of 100 eligible people each month. Because there is significant overlap between the data-driven referrals each month, we expect the data-driven process to refer a total of 250-300 distinct people over a one-year period. We also expect that 60%-70% of provider referrals will appear in the data-driven referral list. 

How does SST case conferencing work?

After an individual is identified through either referral pathway, the SST enrollment process begins with a case conference in which the team reviews available information to determine whether the person’s needs align with the program’s eligibility criteria. This review process is augmented with summaries provided utilizing a Large Language Model (LLM) based on data from the Homeless Management Information Systems (HMIS) and a number of Electronic Health Record (EHR) systems.

Data-Driven Model Implementation

The data-driven referral list is created using a composite of four data-driven models and filtered based on the set of eligibility criteria previously described. The composite is a deterministic function of four data-driven models that predict binary outcomes (0,1)

This table provides details of the models, providing description, base rate and reason for each.
Predictive OutcomeDescriptionBase Rate in CountyReason for Inclusion
Number (n)Percent (%)
Involuntary hospitalization (302) within one yearA binary outcome (0,1) equal to one if there is an upheld 302 petition for an individual in the year following the referral date2,5090.47%Legally, 302s in Allegheny County are designed to allow for intervention when individuals managing mental health crises present a danger to themselves or others. For SST referrals, a 302 is used as a proxy for individuals for whom step-down behavioral health services are not working.
Allegheny County Jail (ACJ) booking within one yearA binary outcome (0,1) equal to one if an individual is booked in ACJ in the year following the referral date5,8701.10%The cohort for whom SST was designed has a materially higher rate of interaction with first responders than the general population. For SST referrals, ACJ booking is used as a proxy for when an individual has a negative interaction with the criminal-legal system.
Indication of being unhoused within one yearA binary outcome (0,1) equal to one if a person checks into a County shelter, continues to stay in a shelter for at least 60 days or interacts with a street outreach team in the year after the referral date2,5150.47%SST is designed to serve people who are unhoused. For SST referrals, encounters with a street outreach team or staying in a shelter is a proxy for a person experiencing homelessness in the future.
Fatal overdose within one yearA binary outcome (0,1) equal to one if there is a Medical Examiner determination of death by overdose on a date within one year after the referral date3380.06%SST serves people who demonstrate profound disability and/or high vulnerability and are chronically disengaged from clinic-based care due of the severity of psychiatric symptoms and/or substance use disorder (SUD). For SST referrals, a Medical Examiner determination of fatal overdose is used to identify individuals experiencing SUD. Given the rarity of this outcome, we are exploring opportunities to replace or augment it as data become available.

SST staff and clients are never shown the raw composite rating or component-model outputs. An individual excluded from the data-driven referral list for any reason is still eligible for a provider referral.

Data-Driven Referral Performance

The composite is used as a proxy for co-occurring severe psychiatric symptoms, chemical dependency, and acute risk of morbidity and mortality. The referral list includes the subset of people who have the highest composite ratings based on the model assessments after filtering for eligibility.

Considering outcomes for the top 50, 100 and 200 people on the list (after filtering for eligibility) helps describe the severity of the situation of the people who are referred. We expect more than 90% of people on the referral list to experience one of the four predicted outcomes in the year after their referral date. In most cases, they will experience more than one.

This table shows the elevated rates at which the predicted outcomes occur among individuals assessed at highest risk by the data-driven model. For each of the predicted outcomes, it compares Precision (the fraction of cases that are a true positive) to the base rates at which outcomes are observed in the training data. It makes this comparison for each of the four predictive outcomes.
MetricACJOverdose302ShelterOne or More
Precision (Top 50)64.0%4.0%34.0%76.0%92.0%
Precision (Top 100)63.0%3.0%24.0%69.0%91.0%
Precision (Top 200)54.5%1.5%17.0%61.5%81.0%
Base Rate Among Unhoused, Eligible Residents16.4%0.5%4.1%40.8%48.4%

Data-Driven Referral Fairness

In addition to performance, we used standard measures to assess the fairness of the data-driven model referrals. The key metric, the sensitivity ratio, is the ratio of recall among demographic subgroups. Recall is the fraction of all cases among the cohort referred by the model in which one or more outcomes occur. We used the Sensitivity Ratio to judge whether the model assigned output fairly based on subgroup demographic. As no process will have a Sensitivity Ratio of exactly 1.0, we consider models with Sensitivity Ratios between 0.7 and 1.3 as performing well according to this fairness diagnostic.

To make this comparison, we ran the referral process once per month on historical data for each month of 2024. The model returned 1,200 referrals, representing 284 unique individuals.

Race

With regards to race, the composite showed slightly higher precision and slightly lower recall for non-White individuals compared to a reference group of White individuals.

This table shows the fairness metrics for non-White and White individuals who would have been referred using the composite and heuristic methodologies. The table captures the precision and recall by group, then uses the recall to calculate sensitivity ratio.
MetricReferral MethodPrecision (non-White)Precision (White)Recall (non-White)Recall (White)Sensitivity Ratio
One or More OutcomesComposite (n=1,200)91.5%88.3%8.1%9.4%0.86

Gender

When comparing gender, we used binary male and female labels because gender data are tracked as a binary in the Allegheny County data warehouse. The composite showed slightly higher precision and slightly lower recall among females than among males.

This table shows the fairness metrics for female and male individuals who would have been referred using the composite and heuristic methodologies. The table captures the precision and recall by group, then uses the recall to calculate sensitivity ratio.
MetricReferral MethodPrecision (Female)Precision (Male)Recall (Female)Recall (Male)Sensitivity Ratio
One or More OutcomesComposite (n=1,200)93.8%88.1%8.5%8.8%0.97

LLM Summary Example

The summaries act as a starting point for case conceptualization. They provide plain text descriptions of a client’s interactions with County services and institutions. Below is an example report that includes synthetic data on housing services and evictions as well as behavioral health services and diagnoses.

Client Report

Client Information

ID:
0000000
FNAME:
Fname
LNAME:
Lname
DOB:
YYYY-MM-DD

Admin Data Summary

Housing Services & Evictions

The client’s first housing-related event was an emergency shelter stay in January 2019. In the past year, the client received Transitional Housing placement, Rapid Rehousing assistance and Permanent Supportive Housing placement, totaling three housing interventions. In the last three months, the client remained in a Permanent Supportive Housing placement, specifically since . The client is currently residing in Permanent Supportive Housing.

Behavioral Health Services & Diagnoses

The client’s first behavioral health event was receiving SUD non-opioid or OUD treatment through HealthChoices in 2003.

In the past year, the client had four interactions with behavioral health services, including:

  • 3 mental health episodes in an emergency room
  • 1 mental health episode with an inpatient visit
  • 1 record of receiving SUD non-opioid or OUD treatment through HealthChoices

In the last three months, the client had two behavioral health events: one emergency room mental health episode and one instance of receiving SUD treatment through HealthChoices, which has been ongoing since .

There are no current ongoing behavioral health events beyond those noted in the past 3 months.

Recent Events (Past 90 Days)

Description Most Recent Event Event Count
Mental health episode in an emergency room 1
Permanent Supportive Housing placement 1

LLM Summary Performance

The goal of the LLM is to format structured data to be more legible and easily accessible to a member of the care team. It should not make choices about what information to include or not include. We used an LLM-as-judge approach with a private GPT 4.1 deployment in our cloud tenant to evaluate performance on a sample of 5,000 summaries. Additionally, we used human review to assess the quality of the LLM judge.

We employed the following LLM-as-judge metrics:

  • Recommendations: The fraction of summaries flagged by a GPT 4.1 evaluator to contain a recommendation or call to action for the reader
  • Information Modified: The fraction of summaries flagged by a GPT 4.1 evaluator to contain event descriptions that are rewritten in a way that changes the meaning of an event from the input artifact
  • Information Excluded: The fraction of summaries flagged by a GPT 4.1 evaluator that omitted an event in the input artifact

The final metric is event miscounts, the fraction of summaries featuring event counts that do not correspond to the count in the input artifact. Event miscounts are computed using regex.

This table shows the metrics used to evaluate language model candidates for use in the summary task. It compares Qwen3-4B-Instruct, Qwen2.5-32B and Llama3.3-70B.
MetricQwen3-4B-InstructQwen2.5-32BLlama3.3-70B
LLM-as-judge
Recommendations0.00%0.00%0.00%
Information Modified1.12%2.80%3.44%
Information Excluded0.04%0.12%0.12%
Event Miscounts0.00%0.00%0.00%
n clients777397397
n summaries5,0002,5002,500

Community Input in SST 

Beginning in late 2023, ACDHS gathered input from stakeholders and practitioners in community mental health and homelessness services to inform and refine the development of the SST design.

The full list of stakeholder engagement conversations, including the purpose and timing of each event, is captured in the appendix of Introducing the Street Stabilization Team Report (PDF, 1MB)

Questions or Feedback?

We welcome your questions and suggestions. To share feedback, you can reach us at DHSResearch@alleghenycounty.us. If you’d like to stay informed, consider signing up for our newsletter. To learn how to use DHS data in your research, please visit our Requesting Data page. Thank you for your time and interest. Your engagement helps shape and improve how we share data that matters.

Web Accessibility Statement

If you encounter any accessibility issues, have difficulty accessing any digital content, or require information presented on a website in an alternate format, please contact the ADA Coordinator or submit a concern through the Accessibility on Allegheny County-owned Websites form.

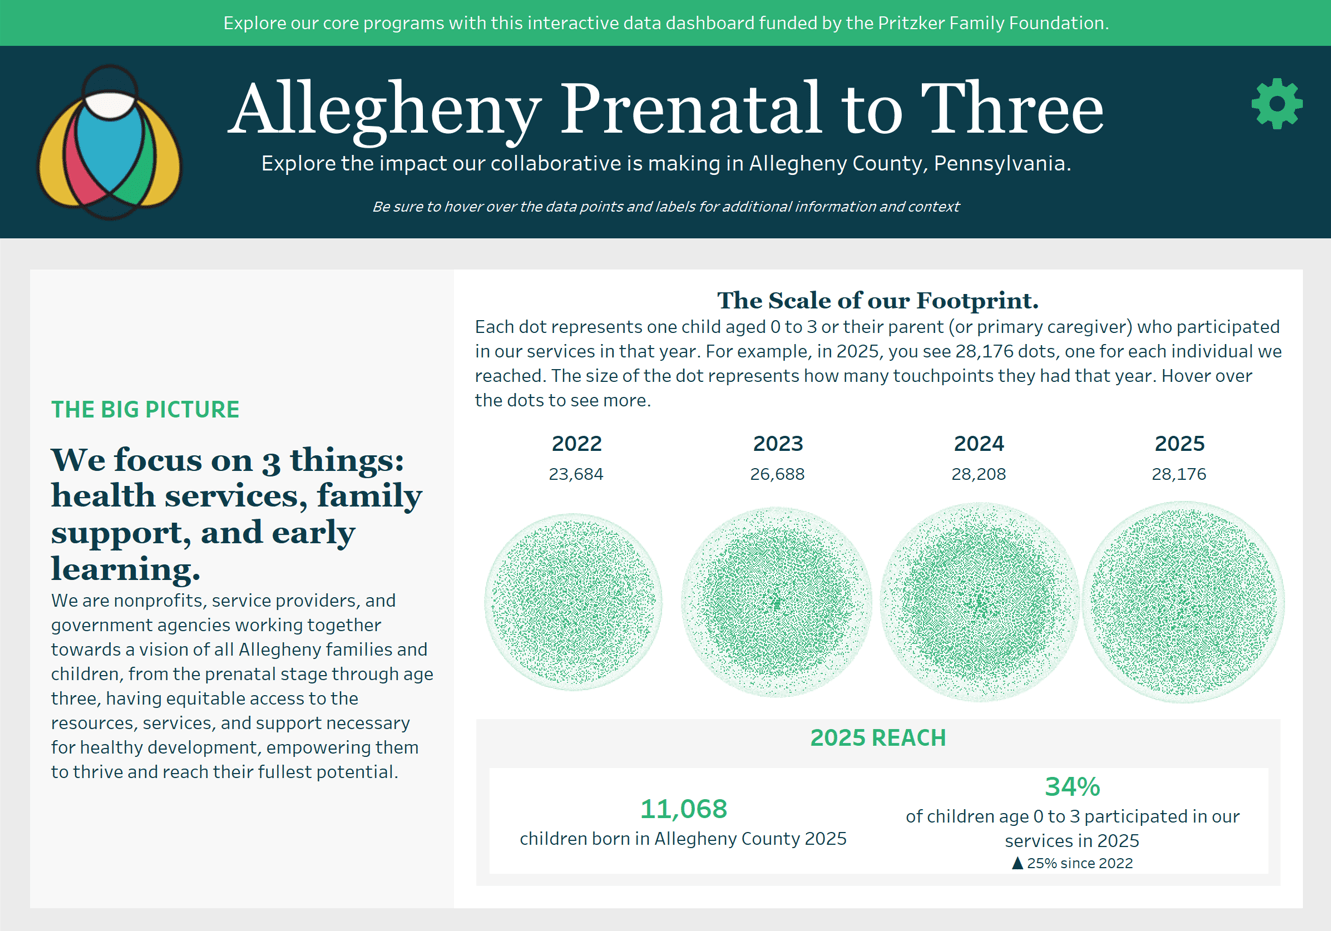
Allegheny Prenatal to Three (PN3) is a countywide collaborative that brings together public agencies, service providers, community organizations and other partners to strengthen the network of services available to families during pregnancy through a child’s first three years of life. The Allegheny Prenatal to Three dashboard uses Allegheny County data to present metrics on the collaborative’s reach and impact in health services, family support and early learning.

Visit the Allegheny Prenatal to Three Impact webpage to explore the dashboard and learn about relevant programs and services PN3 covers.

Questions or Feedback?

We welcome your questions and suggestions. To share feedback, you can reach us at DHSResearch@alleghenycounty.us. If you’d like to stay informed, consider signing up for our newsletter. To learn how to use DHS data in your research, please visit our Requesting Data page. Thank you for your time and interest. Your engagement helps shape and improve how we share data that matters.

Web Accessibility Statement

If you encounter any accessibility issues, have difficulty accessing any digital content, or require information presented on a website in an alternate format, please contact the ADA Coordinator or submit a concern through the Accessibility on Allegheny County-owned Websites form.
Each year, the Allegheny County Department of Human Services (ACDHS) identifies a set of strategic initiatives—bold, transformative and forward‑looking priorities that address the County’s most pressing human service needs. These initiatives guide system‑level improvements, strengthen supports for residents and advance long‑term goals across programs and services.

This page serves as a central place for the public to explore past and current strategic initiatives and accomplishments. Together, these initiatives and accomplishments demonstrate ACDHS’s commitment to transparency, continuous improvement and delivering effective services for all Allegheny County residents.

Looking for additional information?

Visit DHS Plans and Budgets to learn about other ways ACDHS invests more than $1 billion in programs and services across key human service areas.

Previous Initiatives and Accomplishments

If you encounter any accessibility issues, have difficulty accessing any digital content, or require information presented on a website in an alternate format, please contact the ADA Coordinator or submit a concern through the Accessibility on Allegheny County-owned Websites form.

Questions or Feedback?

We welcome your questions and suggestions. To share feedback, you can reach us at DHSResearch@alleghenycounty.us. If you’d like to stay informed, consider signing up for our newsletter. To learn how to use DHS data in your research, please visit our Requesting Data page. Thank you for your time and interest. Your engagement helps shape and improve how we share data that matters.

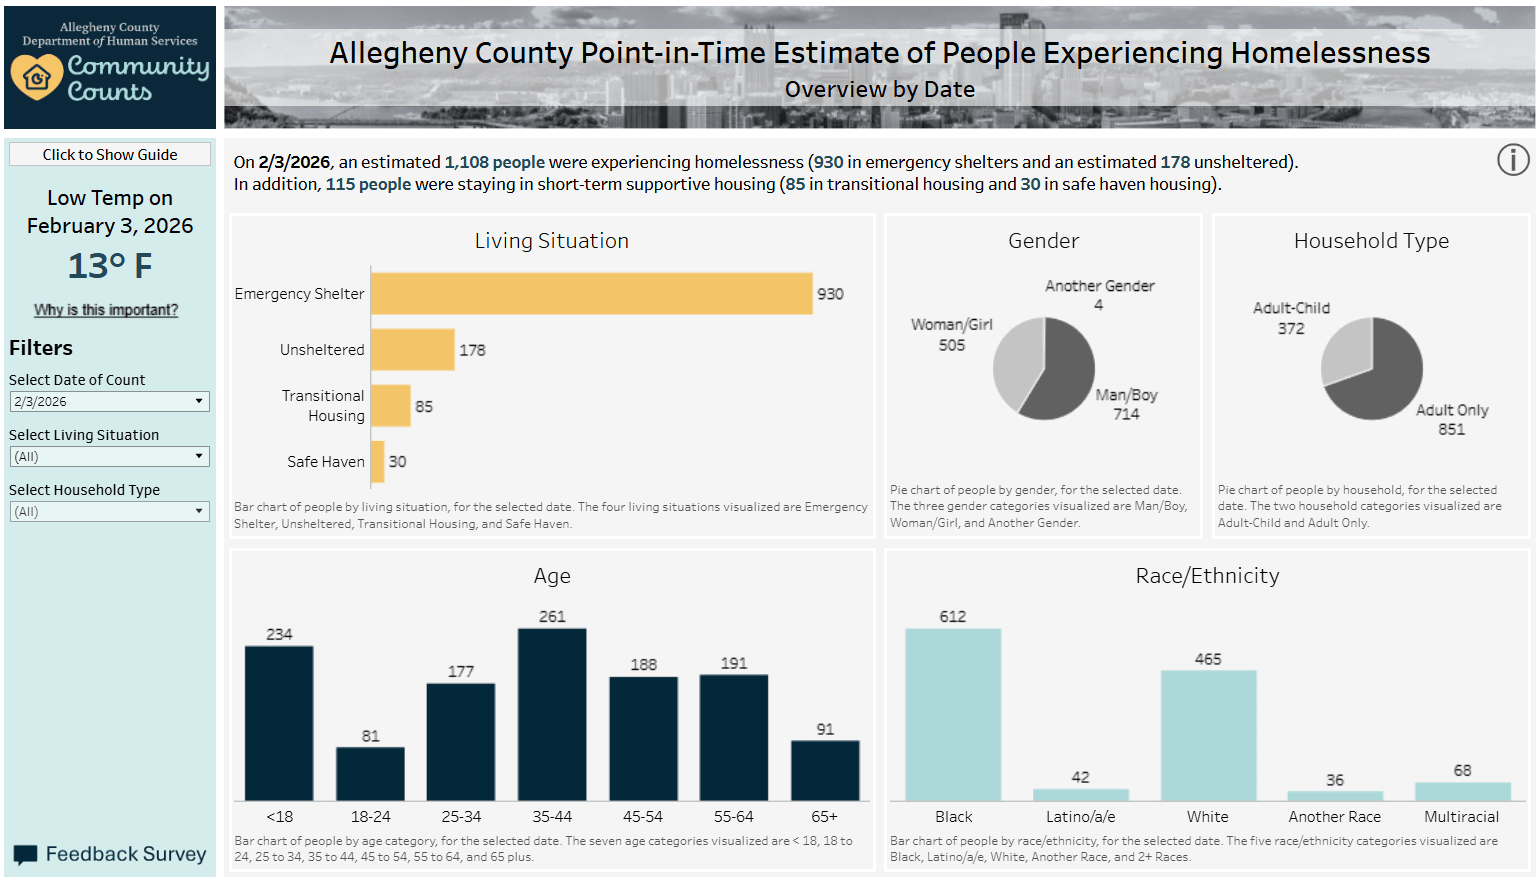
As required by the US Department of Housing and Urban Development (HUD), Allegheny County conducts an annual Point-in-Time count of individuals experiencing homelessness on a single night. The count identifies individuals who are sheltered (residing in emergency shelters), unsheltered (residing in places not meant for human habitation), or participating in a short-term housing program (bridge and safe haven).

2026: A New Approach

In 2026, Allegheny County launched “Community Counts,” a reimagining of this annual effort that marked the start of a new, volunteer-driven approach to the unsheltered estimate. The new methodology emphasizes geographic coverage using statistically valid sampling and can be replicated to allow for more accurate year-over-year trends.

Due to a major snowstorm at the end of January 2026, Community Counts was delayed by one week and conducted from the night of Tuesday, February 3rd into the morning of Wednesday, February 4th. The overnight low temperature was 13°F and the region remained snow-covered. Despite the weather, about 270 volunteers joined the effort.

Key Takeaways

  • Most (84%) of Allegheny County’s total estimated homeless population on the night of the count were in shelter as opposed to staying outside. Although the County had sufficient capacity to serve more people in shelter, some people remained outside despite the frigid temperatures and snow. Individuals may stay outside for many reasons, including lack of alignment between available shelter and individual needs (e.g., location and accessibility), concerns related to safety or prior negative experiences in congregate shelter settings, behavioral health challenges, or barriers related to partners, pets and/or personal belongings. Street outreach teams continue to work with these individuals to build trust over time, understand barriers to coming indoors, and, when they are ready, provide connections to services.
  • This year’s estimated unsheltered population of 178 people (all adults) is a new baseline. Using the same methodology next year will allow us to begin to compare year-over-year trends.
  • The unsheltered population appears to have been concentrated in the same general regions within the County as last year (South Side, South Hilltop, Homewood, the Central Business District and North Side), but in some cases, shifted within those areas.
  • Abandoned houses/buildings and tents/temporary shelters were the most common unsheltered sleeping locations. Twenty percent of those counted as unsheltered had an unknown sleeping location as they were not yet bedded down when surveyors observed or attempted to interview them.
  • We have more to learn about where people are unsheltered. Surveyors identified a small number of people experiencing unsheltered homelessness outside of known areas, even with a simple random sample. The research team is exploring ways to stratify next year’s random sample to reflect that some areas and types of places are less likely to have people sleeping unsheltered.
  • Volunteers had positive experiences and good ideas for next year. In a feedback survey, 90% of respondents said they would volunteer again next year and were likely to recommend the event to a friend (average score eight out of 10). For next year’s Community Counts, we plan to enhance training, improve survey area navigation, provide additional supplies to hand out, and add at least one hub so that the number of teams is capped at 15 per hub.

Dashboard

For the best experience, we encourage exploring the Community Counts Dashboard on its full site.

Additional Resources

The annual count is one way to understand trends in homelessness in the County. ACDHS maintains two other dashboards that provide additional insights:

Trends in sheltered and unsheltered homelessness dashboard

Presents daily counts of people using shelter and weekly counts of street outreach clients with recent stays outside

Encampment dashboard

Monitors visible tent encampments in Downtown Pittsburgh and riverfront trails, updated weekly

Questions or Feedback?

We welcome your questions and suggestions. To share feedback, you can reach us at DHSResearch@alleghenycounty.us. If you’d like to stay informed, consider signing up for our newsletter. To learn how to use DHS data in your research, please visit our Requesting Data page. Thank you for your time and interest. Your engagement helps shape and improve how we share data that matters.

What is the DHS case competition?

Each year, the Allegheny County Department of Human Services (DHS) hosts a competition for local graduate students that challenges interdisciplinary teams to solve a problem in local government.

What information is available?

Yearly reports, below, describe the case topic and students’ proposed solutions. A short video explains the event.


All reports

  • 2025: Using Large Language Models to Strengthen Local Government and Human Services
  • 2024: Improve Service Access for Humanitarian Immigrants
  • 2023: Improving outcomes for people involved in an involuntary commitment
  • 2022: Innovating in the Aftershock of COVID-19: A Post-Pandemic Local Government Playbook
  • 2019: Human Service Delivery in the Gig Economy
  • 2018: Emerging Technologies to Address Human Service Problems
  • 2017: Rethinking Human Services Delivery
  • 2016: Improving Systems to Help People with Barriers Gain and Sustain Employment
  • 2015: Making Transportation Work: Creating Access and Ensuring Equity
  • 2014: Pathways to Safe and Affordable Housing for People Involved in the Human Services System
  • 2013: Building a Human Services Workforce for the 21st Century
  • 2012: Addressing Suburban Poverty and Those Affected by It
  • 2011: Reducing Stigma among Individuals with Serious Mental Illness
  • 2010: Pittsburgh Public Schools and the Pathways to the Promise
  • 2009: Building the Homewood Children’s Village
  • 2008: Greening DHS
  • 2007: The Future of DHS

In the last eight years, the number of Americans experiencing homelessness in the United States has increased by 40%, even as the supply of subsidized housing has doubled. Research shows that housing programs effectively support housing stability. However, system-level outcomes depend on whether housing reaches people likely to exit shelter quickly or those likely to experience longer-term housing instability. Systems that prioritize people with shorter expected stays reduce homelessness less than when they prioritize people facing longer-term instability. Using administrative data from Allegheny County, this policy brief and working paper examine how often housing does not reach those with the greatest need, identify and characterize those who do not receive services, and outline how to recognize these individuals before their homelessness becomes long-term.

Key Results

Using administrative data from Allegheny County, we have developed a predictive model that identifies—at the time of shelter entry—individuals likely to experience an extended shelter stay.

  • Most shelter residents exit shelter on their own within weeks after starting their shelter stay.
  • Among the highest-risk individuals flagged by the model, over 40% go on to experience extended homelessness—over three times the baseline rate.
  • Allocating housing to individuals or families at the highest risk of prolonged shelter stays would prevent approximately 2.4 times more shelter days per unit than allocating to the average shelter resident.
  • Making housing allocations based on the predictive model rather than current federal prioritization criteria would prevent 120% more shelter days.
  • Shifting from retrospective to prospective targeting could substantially reduce overall homelessness without expanding the subsidized housing supply.

Why This Matters and What’s Next

Homelessness remains difficult to solve. These data highlight a core challenge: most individuals resolve occurrences of homelessness quickly, while housing supports take time to deploy.

Without thoughtful allocation, resources do not reach people with the greatest need. Allegheny County continues to develop approaches that prioritize resources for individuals at highest-risk. This principle already guides ACDHS programs such as 500 in 500 and the Allegheny Housing Assessment, which have successfully prioritized individuals for housing in times of acute need.

Questions or Feedback?

We welcome your questions and suggestions. To share feedback, email us at DHSResearch@alleghenycounty.us. If you’d like to stay informed, consider signing up for our newsletter. To learn how to use ACDHS data in your research, please visit our Requesting Data page. Thank you for your time and interest. Your engagement helps shape and improve how we share data that matters.

Current information

This page presents data on opioid use disorder, overdose trends and treatment engagement in Allegheny County, drawing on available data covering through 2023 and early 2024. The content focuses on patterns of engagement with medications for opioid use disorder (MOUD) and describes how connection varies across populations, service settings and providers. We invite you to explore this page and the report to better understand recent trends and system-level patterns in Allegheny County.

Key Takeaways

  • OUD remains widespread. Opioid use disorder affects about 5% of Allegheny County residents each year, yet many people who use opioids outside medical guidance do not receive active treatment.
  • Fatal overdose disparities have grown. Recent trends show widening racial inequities in overdose deaths, with Black residents dying at much higher rates than White residents.
  • Treatment engagement differs by race among Medicaid enrollees. Analysis of Medicaid claims shows that White enrollees engage in OUD-related behavioral health services and connect to medications for opioid use disorder (MOUD) at higher rates than Black enrollees.
  • MOUD connection coincides with lower fatal overdose rates. Among Medicaid enrollees who engage in OUD services, those who connect to MOUD shortly after service initiation experience lower subsequent fatal overdose rates than those who do not.
  • Despite the association between MOUD connection and lower overdose risk, many individuals who engage in OUD services do not connect to MOUD. Connection rates remain below 40% and vary by service type and provider.

What’s Next

Since 2023, Allegheny County—like much of the nation—has experienced a decline in fatal overdoses (Click here to explore overdose trends in the county). Building on this progress, the County remains focused on further reducing overdose deaths and mitigating the harms associated with opioid use disorder. The report describes multiple initiatives supported by opioid settlement funds that aim to strengthen treatment access, recovery supports, harm reduction, prevention and innovation. Examples include: mobile MOUD sites, MOUD via telehealth, warm handoffs from emergency departments, recovery and low-barrier housing, syringe service programs, youth prevention supports, contingency management and wastewater monitoring.

Together, these investments reflect a coordinated, cross-system approach to the work ahead—expanding pathways into treatment, lowering barriers to sustained care, and adapting to an increasingly volatile and dangerous drug supply. To remain informed on how Allegheny County uses opioid settlement funds and to learn about related initiatives, visit the Allegheny County Opioid Settlement Projects page.

Questions or Feedback?

We welcome your questions and suggestions. To share feedback, you can reach us at DHSResearch@alleghenycounty.us. If you’d like to stay informed, consider signing up for our newsletter. To learn how to use DHS data in your research, please visit our Requesting Data page. Thank you for your time and interest. Your engagement helps shape and improve how we share data that matters.

We invite you to explore this page and its resources to learn about two data driven models—the Allegheny Housing Assessment (AHA) and the Mental Health Allegheny Housing Assessment (MH-AHA). These are decision support tools that the Allegheny County Department of Human Services (DHS) uses to improve equity and transparency in how we prioritize placement—and ultimately improve outcomes—in housing and mental health residential services.

Allegheny Housing Assessment (AHA)

Permanent Supportive Housing (PSH) and Rapid Rehousing (RRH) are two long-term housing programs operated by Allegheny County’s Continuum of Care (CoC). Because referrals for placement in these programs exceed capacity every year, we have to prioritize for placement those who are at highest need and would benefit from it the most.

The Allegheny Housing Assessment (AHA) is a tool that uses administrative data to support decision making in this prioritization process. It is a significant improvement from the previous method of prioritization, which required the use of a lengthy questionnaire that was time-consuming to administer, distressing to applicants and unreliable. In August 2020, DHS implemented the Allegheny Housing Assessment (AHA), a model developed by a team led by Dr. Rhema Vaithianathan and partners at the Centre for Social Data Analytics↗. This model has been shown to improve equity in the allocation of housing resources. As part of DHS’s commitment to continued quality assurance, it was updated in 2025.

About the AHA Model

Agency Deploying Data-Driven Model: Allegheny County DHS
Scope: Provide decision support to inform prioritization of placement in Permanent Supportive Housing (PSH) and Rapid Rehousing (RRH)
Status: In Use
Date of Deployment: August 2020
Last Updated: August 2025

Consult the Frequently Asked Questions About AHA↗ for additional information.

Goals and Purpose of AHA

The AHA is a decision support tool that helps DHS prioritize admissions to Rapid Rehousing (RRH) and Permanent Supportive Housing (PSH). The model assists in prioritization by identifying individuals who are at risk of a set of adverse outcomes related to homelessness.

How the AHA Model Works

The AHA is comprised of four component models that each predict a different outcome: inpatient mental health stays, four or more emergency department visits, jail bookings, and homelessness within a year of the assessment date. The first three outcomes were used to develop the November 2020 version of the model, while the homelessness component was added to the 2025 update.

The training data for the updated AHA model is comprised of 18,008 RRH/PSH assessments from 2016 through 2024. The component models are random forests tuned using subject-wise cross-validation to estimate the likelihood of their respective outcomes. These probabilities are weighted and combined to generate a 1-10 integer score, where 10 represents highest risk and 1 represents lowest risk.

Read the most recent AHA methodology update here.

Read the full AHA methodology report here.

AHA’s Performance

Allegheny Housing Assessment (AHA)
OutcomeArea Under the Curve (AUC)Prevalence among AHA 10s (Positive Predictive Value)True Positive Rate Among AHA 10sBaseline Prevalence
Mental Health Inpatient0.7129%26%12%
Emergency Room 4+ Visits0.6646%21%24%
Jail Booking0.7239%22%16%
Any Homelessness0.6858%16%32%

While the AUC and Positive Predictive Value performance for the first three outcomes are similar in the 2020 and 2025 versions, inclusion of the homelessness component model in the 2025 update significantly improves AHA’s identification of homelessness risk, from an AUC of 0.54 to 0.68.

In addition to pre-deployment performance evaluation, the scores that are generated daily are monitored on an ongoing basis for both drift and unusual distribution.

Read the most recent AHA methodology update here.
Read the full AHA methodology report here.

AHA Equity Considerations

The August 2020 AHA model was subject to a thorough fairness and equity review by Eticas, which found that there were few concerns regarding the model’s fairness across various groups. This represented an improvement in the racial equity of housing services in the County. In the process of updating AHA, we ensured that resources would continue to be allocated equitably.

The table below compares the gender and race breakdown of AHA 10s between the 2020 and 2025 models. Allocations across racial groups appear similar in the updated model, but there is a shift in allocations between genders. In the new model, more men and fewer women would be assigned housing for both singles and families. This shift is likely due to the large difference in homelessness risk between men (38% one-year homelessness risk) and women (26%). Because the updated model includes the homelessness component, it prioritizes more men for housing than the earlier version.

Gender and Race Allocations
 AHA 10s, Aug. 2025 ModelAHA 10s, Nov. 2020 Model
Black50%46%
White49%48%
Female24%34%
Male76%62%


DHS will continue to advance equity and transparency in our predictive risk models/data-driven models through external audits and release of statements to the public. To learn about what DHS has already done to support equity and transparency, see Etica’s algorithmic impact assessment and DHS’s response to the algorithmic audit.

Community Input in AHA Adoption

There has been rich public engagement throughout the development of AHA, including involvement from policy makers, community groups, industry experts and the general public. Specifically, individuals experiencing homelessness, local service provider agencies, national homelessness experts, advisory boards and committees, DHS leadership, local funding agencies and foundations, and representatives from the U.S. Department of Housing and Urban Development (HUD) have all contributed to AHA’s development. Formats for engagement have included focus groups and presentations, where stakeholders could express optimism or share concerns about the model.

  1. Community feedback surfaced concerns about the accuracy and completeness of administrative data on the homelessness population. This feedback resulted in the implementation of quality assurance protocols and alternative self-report predictive assessment tools, improvements that aim to support the assessment process but not replace clinical judgement for decision-making.
  2. National Feedback sourced from conferences and conventions provided DHS with cross-sector expert input, including professional feedback from leading experts in fields covering data science, analytics and ethics. The insights drawn from these specialists support DHS’s mission to use predictive risk models ethically and responsibly, for the purpose of improving human service systems’ responses to evolving community needs.

DHS will continue to promote and engage in two-way communication that both centers community voices and informs staff and partners—whether it be through focus groups with people experiencing homelessness or discussions with providers. To learn about what DHS has already done, see the Focus Group Report and the Overview of Models and Implementation video.

AHA Publications & Resources

Allegheny Housing Assessment (AHA)
Name of Resource/PublicationTypeDate Published/UpdatedFormatNotes
Frequently Asked Questions About AHAFAQrev. January 2026PDFSecond update; reflects continued refinements
Allegheny Housing Assessment:
Updated Methodology Report
Methodology Report [Update]rev. January 2026PDFPlain-language resource for providers/community
Overview of Models and Implementation: Office of Behavioral Health and Executive Director DiscussionOverview/TrainingJuly 2024Video (Web)Walk-through for behavioral health providers
Using Predictive Risk Modeling to
Prioritize Services for People Experiencing
Homelessness in Allegheny County
(Dec. 2020)
Methodology Report [Update]December 2020PDFFirst update; reflects refinements after early implementation
Report on Client Focus Groups (AHA)Focus Groups ReportDecember 2020PDFShort report on focus group methodology, results, conclusions
Algorithmic Impact Assessment of the Predictive System for Risk of Homelessness Developed for Allegheny CountyAlgorithmic Audit / EvaluationDecember 2020PDFIndependent data science review; technical and ethical considerations
Allegheny County Department of Human Services’ Response to Eticas’ report,
“Algorithmic Impact Assessment of the
Predictive System for Risk of Homelessness”
DHS ResponseDecember 2020PDFDHS statement; addresses reviewer concerns and outlines commitments
Using Predictive Risk Modeling to
Prioritize Services for People Experiencing
Homelessness in Allegheny County
(Sept. 2020)
Methodology ReportSeptember 2020PDFFoundational methodology; describes model design

Mental Health Allegheny Housing Assessment (MH-AHA)

Mental Health Residential (MH-Res) programs are a high-demand resource that require prioritization and waitlist management. The purpose of the Mental Health Allegheny Housing Assessment (MH-AHA) is to identify people who are at the highest risk of future mental health inpatient stays and repeated ER visits and thus most in need of MH-Res services. This model offers a low-cost and data-driven way to assess individuals in Allegheny County for their level of need to help prioritize this limited resource. 

About the MH-AHA Model

Agency Deploying Data-Driven Model: Allegheny County DHS
Scope: Identify individuals at high risk of negative outcomes to prioritize access to mental health residential programs
Status: In Use
Date of Deployment: February 2023
Last Updated: August 2025

Consult the Frequently Asked Questions About MH-AHA↗ for additional information.

Goals and Purpose of MH-AHA

In February 2023, DHS implemented the Mental Health – Allegheny Housing Assessment (MH-AHA), developed by a team led by Dr. Rhema Vaithianathan at the Centre for Social Data Analytics. The MH-AHA is a decision support tool that helps DHS prioritize admissions to mental health residential programs. The model assists in prioritization by identifying individuals who are at risk of a set of adverse outcomes related to mental and physical health.

How the MH-AHA Model Works

The training data for the MH-AHA model is comprised of 13,673 RRH/PSH assessments from 2016 through 2024 for people who were enrolled in Medicaid at the time of their assessment. The model is comprised of two component models; each predicts a different outcome: 1) inpatient mental health stays and 2) four or more emergency department visits within one year of assessment. The component models use DHS warehouse data to generate probabilities of their respective outcomes. These probabilities are combined to generate a 1-10 integer score, with 10 indicating highest risk and 1 indicating lowest risk. 

Read the full MH-AHA methodology report here.

MH-AHA Performance

The updated MH-AHA model was evaluated along several dimensions of performance and fairness, both in absolute terms and by comparison to the February 2023 version of the model. Model performance for the two outcomes is shown in the table below:

Mental Health Allegheny Housing Assessment (MH-AHA)
OutcomeArea Under the Curve (AUC)Prevalence among MH-AHA 9 and 10s (Positive Predictive Value)True Positive Rate Among MH-AHA 9 and 10sBaseline Prevalence
Mental Health Inpatient0.7348%34%25%
Emergency Room 4+ Visits0.7852%48%18%

The area under the curve (AUC) and Positive Predictive Value (PPV) performance improved from the 2023 model to the 2025 update for both outcomes. AUCs improved from 0.64 and 0.75 to 0.73 and 0.78 for Mental Health Inpatient and Emergency Room 4+ Visits, respectively, and the PPV improved by 7 to 8 percentage points for each outcome.

In addition to pre-deployment performance evaluation, we monitor the scores that are generated, on a daily basis, for drift and unusual distribution.

Read the full MH-AHA methodology report here.

MH-AHA Equity Considerations

While different subsets of the training set can present different levels of risk (meaning that the risk for certain subgroups can be under- or over-estimated), it is important that the model selects a treatment group that is equally at-risk across subgroups. For this reason, we performed a full equity analysis looking at the precision and recall across the sensitive categories of race and gender.

We also examined how the model update might change the distribution of resource allocations. The table below compares the gender and race breakdown of MH-AHA 9s and 10s between the 2023 and 2025 models. Allocations across racial and gender groups are nearly the same in the updated model, which indicates that there has not been a shift in equity.

Gender and Race Allocations
 MH-AHA 9-10s, Aug. 2025 ModelMH-AHA 9-10s, Feb. 2023 Model
Black50%52%
White50%44%
Female46%48%
Male53%52%


DHS will continue to advance equity and transparency around use of predictive risk models/data-driven models through external audits and by releasing statements to the public. To learn about what DHS has already done to support equity and transparency, see Etica’s algorithmic impact assessment and DHS’s response to the algorithmic audit.

Community Input in MH-AHA Adoption

There has been broad public and professional engagement in the development of MH-AHA:

  1. Feedback provided from AHA’s engagement process directly informed the development of MH-AHA. The cross-sector input gathered for AHA from experts in multiple fields established the foundation that DHS carried forward to implement MH-AHA. Experts included researchers, machine learning experts, homelessness policy and program administration experts, cyber law experts, ethicists, privacy experts and representatives from HUD. To learn more about the community’s involvement in AHA (and thereby MH-AHA), please review the section on Community Input in AHA Adoption.
  2. MH-AHA also included input from providers, DHS staff and local judges, who recognize that the availability—or lack thereof—of residential mental health housing is an important consideration when making crucial service and/or judicial decisions. 

These elements of MH-AHA’s development ensure both system-level and community-based considerations shape MH-AHA’s design and use.

DHS will continue to promote and engage in two-way communication that both centers community voices and informs staff and partners—whether it be through focus groups with people experiencing homelessness or discussions with providers. To learn about what DHS has already done, see the Focus Group Report and the Overview of Models and Implementation video.

MH-AHA Publications & Resources

Mental Health Allegheny Housing Assessment (MH-AHA)
Name of Resource/PublicationTypeDate Published/UpdatedFormatNotes
Overview of Models and Implementation: Office of Behavioral Health and Executive Director DiscussionOverview/TrainingJuly 2024Video (Web)Walk-through for behavioral health providers
Methodology Report for the Mental Health–Allegheny Housing Assessment ToolMethodology ReportNovember 2023PDFFoundational report; documents model development
Frequently Asked Questions About the Implementation of the MH-AHA ToolFAQNovember 2023PDFPlain-language resource for providers/community

Questions or Feedback?

We welcome your questions and suggestions. To share feedback, email us at  DHSResearch@alleghenycounty.us. If you’d like to stay informed, consider  signing up for our newsletter. To learn how to use DHS data in your research, please visit our Requesting Data page. Thank you for your time and interest. Your engagement helps shape and improve how we share data that matters.

Allegheny County’s Department of Human Service is responsible for providing and/or overseeing publicly funded mental health and substance use services. The majority of behavioral health funding for Allegheny County flows through the HealthChoices Program (Medicaid dollars), though the County provides additional base funding to cover treatment services for un- and under-insured individuals and for services not covered by Medicaid (e.g., supportive housing). Funded services aim to effectively address both immediate and long-term behavioral health needs for children, youth, adults and families facing challenges related to mental health and/or substance use diagnoses. DHS invites you to review this page and its related content to learn about utilization of behavioral health services in Allegheny County.

Dashboard Content

The Publicly Funded Behavioral Health Services Dashboard presents data on client demographics, diagnoses, types of services, providers and costs associated with behavioral health service use. This dashboard has four tabs:

    1. Homepage describes the organizational structure of behavioral health services, identifies the goals of such services, defines the scope of the dashboard contents and reveals the value in understanding behavioral health service use.
    2. About this Dashboard builds upon the information introduced on the homepage—offering increased details on data sources, funding streams, types of services and organizational relationships that shape Allegheny County’s behavioral health system.
    3. Client Summary is an interactive tab where users can explore service engagement over time by analyzing demographics, service categories and diagnoses with options to filter data by funders, providers and levels of service.
    4. Cost Summary is an interactive tab that displays trends in costs for fee for service behavioral health service claims. Users can filter data by type of claim, payor, timeframe, providers and levels of service; users can adjust views to display data by service categories, diagnoses, units and/or costs.

The dashboard updates daily and covers data from January 1, 2018 to the present, with a three-month reporting lag.

How the County Uses this Information

The county uses this dashboard to:

    1. Monitor trends in behavioral health service use.
    2. Identify disparities in service engagement across populations.
    3. Make data-informed decisions that guide planning, funding and improvement efforts that best meet public needs.
    4. Promote transparency and build shared understanding around use and costs of behavioral health services
    5.  

    Trouble viewing the dashboard below? You can view it directly here.

    Questions or Feedback?

    We welcome your questions and suggestions. To share feedback, you can reach us at DHSResearch@alleghenycounty.us. If you’d like to stay informed, consider signing up for our newsletter. To learn how to use DHS data in your research, please visit our Requesting Data page. Thank you for your time and interest. Your engagement helps shape and improve how we share data that matters.

    We invite you to view this page and the Substance Monitoring Interactive Dashboard to learn about substance use in Allegheny County.

    Background

    Traditional data to track substance use—such as hospital records, medical claims and overdose fatalities—are delayed and incomplete. These methods also miss the emergence of new substances in communities. To close these gaps in knowledge and service engagement, Allegheny County partners with Prevention Point Pittsburgh and the UNC Street Drug Analysis Lab to provide drug checking and Biobot for wastewater surveillance.

    By combining data on wastewater analysis and drug checking results, Allegheny County has an increased understanding of local trends in the drug supply and in volume of substance use. This information, coupled with the more traditional data on substance use, helps the County make data-informed decisions that enhance the timeliness and effectiveness of substance use prevention, intervention and treatment efforts.

    Dashboard Content

    The Substance Monitoring Interactive Dashboard has six main sections:

      1. Homepage: The Homepage presents the purpose of the dashboard, outlines the gaps in substance use monitoring, and introduces the two core data sources for this dashboard: wastewater analysis and drug checking results.
      2. Wastewater Surveillance Data is an interactive tab where users can filter by type of high-risk substance, track its presence in wastewater over time, and compare local, regional and national findings.
      3. PPP Drug Checking Results is an interactive tab that allows users to select substances of interest, adjust timeframes, and compare suspected and actual sample contents.
      4. About Wastewater Data details the collection and testing process conducted by Allegheny County Sanitary Authority (ALCOSAN) and Bibot, defines parent drugs and metabolites, and includes a brief glossary of some high-risk substances.
      5. About Drug PPP Checking defines drug checking, describes how Prevention Point Pittsburgh and the UNC Street Drug Analysis Lab collaborate and states the value drug checking provides the community.
      6. Wastewater Download View is a tab that lets users view and download data on the effective concentration for high-risk substances in wastewater, with filters for substance name, drug type, region and date range.

    The data contained in this dashboard serves as indicators of broad trends and emerging risks in the community rather than exact prevalence rates in substance use.

    How the County Uses this Information

    DHS and its partners use the dashboard to:

    1. Monitor substance use trends in Allegheny County.
    2. Supplement traditional data sources to fill gaps in drug tracking.
    3. Identify emerging risks and make informed adjustments to outreach efforts.
    4. Coordinate with agencies and providers to deliver timely, targeted harm reduction interventions.
    5. Compare local data with broader contexts to guide planning and resource allocation.


    Trouble viewing the dashboard below? You can view it directly here.


    Questions or Feedback?

    We welcome your questions and suggestions. To share feedback, you can reach us at DHSResearch@alleghenycounty.us. If you’d like to stay informed, consider signing up for our newsletter. To learn how to use DHS data in your research, please visit our Requesting Data page. Thank you for your time and interest. Your engagement helps shape and improve how we share data that matters.

    We invite you to explore this page to understand how Allegheny County is using settlement funds to address the opioid epidemic.


    In 2021 and 2022, states and localities reached historic settlements with manufacturers and distributors of opioids, as well as pharmacy chains and a consulting firm, for their roles in the opioid epidemic. As a result of these settlements, Allegheny County will receive annual payments in varying amounts, every December, through at least 2038.

    Two major objectives guide Allegheny County’s use of opioid settlement funds:

    • reducing fatal overdoses
    • reducing the harms from opioid use disorder

    The flexible nature of the settlement funds compared to other funding streams strengthens Allegheny County’s ability to:

    • provide stability for effective existing programs, especially when other funding is uncertain or inadequate
    • expand effective services and build capacity—such as covering upfront operational costs—that Medicaid or other healthcare funding does not cover
    • support emerging strategies and fund innovative solutions aimed at addressing the opioid epidemic

    Dashboard and Reports

    The dashboard and reports—housed on this page—track the use of settlement funds and document the outcomes of the investments.

      1. 2024 Opioid Settlement Fund Report (Published 2025): describes the County’s strategy to address the opioid epidemic and the programmatic investments made with opioid settlement dollars in 2024.
      2. Opioid Settlement Community Listening Sessions Findings: reports the results and findings from community listening sessions held in 2024. Community priorities for opioid settlement spending included: expanding treatment access, reducing harm and stigma, improving housing stability and investing in family strengthening supports and services.
      3. Opioid Settlement Dashboard (2022-Present): displays an interactive dashboard that tracks Allegheny County’s spending of opioid settlement funds across different programs and priorities.

    Previous:

      1. 2023 Opioid Settlement Fund Report (Published 2024): details how Allegheny County used it’s first installment of opioid settlement funds.

    Key Takeaways

    1. Decrease in fatal overdoses: There was a 35% decline in fatal overdoses from January to August 2024 compared to the same period in 2023 (301 compared to 466).
    2. Decline in wastewater levels for norfentanyl and xylazine:
      1. The concentration of norfentanyl (a proxy for fentanyl) in wastewater dropped by more than 60% from March 2024 through the end of December 2024.
      2. The concentration of xylazine (a drug often used in veterinary medicine as a sedative) in wastewater levels had a sharp decline over the course of 2024, falling over 80%.
    3. Expansion of treatment in jail: The total count of individuals receiving any medication for opioid use disorder (MOUD) in the jail more than doubled from 2023-2024—from 889 to 1,800.
    4. Growth of mobile and telehealth treatment access:
      1. Mobile units operated by Prevention Point Pittsburgh (PPP) served 600 patients in high need communities at no cost.
      2. Telemedicine services offered by the UPMC Bridge Clinic—a fast turnaround MOUD prescribing service—had over 2,000 encounters in 2024, and most patients accessed medication within two hours of their telehealth visit.
    5. Support for community-led solutions: In 2024, Allegheny County dedicated nearly $1 million in settlement funds to support initiatives led, designed or operated by highly impacted communities.
    6. Investments in harm reduction strategies: In 2024, syringe services reached 700 new visitors and 3,000 returning visitors. The service program collected approximately 40 cubic feet of medical waste each month by collecting used supplies (e.g., needles, syringes) from visitors—supporting safe handling and disposal of medical waste in the community.
    7. Direction from the community: 2024 settlement investments reflected community input from the listening sessions—demonstrating Allegheny County’s commitment in shared decision-making.

    How the County Uses this Information

    Allegheny County uses the dashboard and reports to ensure it uses opioid settlement funds responsibly, equitably and effectively. Specifically, the County uses this information to:

    1. Monitor trends and outcomes in overdoses, treatment access and disparities across populations.
    2. Fill service gaps by directing funds to under-funded effective programs and by financing programs prioritized or endorsed by the community.
    3. Invest in evidence-based supports and services that support the improvement of current programs, the piloting of new initiatives and the design of innovative solutions.
    4. Drive continuous improvement efforts that strengthen partnerships and improve coordination across Allegheny County.
    5. Share insights and lessons learned with other communities and jurisdictions looking to pursue similar efforts.
    6. Strengthen public trust through advancing transparency in use of funds.

    What’s Next

    For 2025-2026, Allegheny County plans to use opioid settlement funds to:

    1. Expand access to low-barrier, high-quality, evidence-based MOUD and recovery support services.
    2. Continue to support treatment in the Allegheny County Jail, including continuity of care post-release.
    3. Increase services in highly impacted communities—improving mobile units for MOUD distribution and wound care, strengthening harm reduction services and enhancing targeted interventions for people at highest risk.
    4. Upgrade supportive housing by investing in recovery housing and permanent supportive housing for people with opioid use disorder.

    Allegheny County has also issued a funding opportunity called the Open Solicitation for Programs that Prevent or Treat Opioid Addiction Under the Guidelines of the Opioid Settlement Fund. Through this Request for Proposals (RFP), Allegheny County seeks additional ideas from the community on how to improve outcomes for groups disproportionately or hardest impacted by the opioid epidemic, particularly the Black community, people who are currently or recently incarcerated, individuals experiencing homelessness, people who inject drugs, and people with chronic pain or disabilities.


    Questions or Feedback?

    We welcome your questions and suggestions. To share feedback, you can reach us at DHSResearch@alleghenycounty.us. If you’d like to stay informed, consider signing up for our newsletter. To learn how to use DHS data in your research, please visit our Requesting Data page. Thank you for your time and interest. Your engagement helps shape and improve how we share data that matters.

    Current Plan and Related Documents

    The Allegheny County Department of Human Services (DHS) partnered with Pittsburgh Regional Transit (PRT) to launch a new transportation assistance program in November 2022 called the Discounted Fares Pilot. This program offered free and reduced-price PRT rides for county residents ages 18 to 64 who receive Supplemental Nutrition Assistance Program (SNAP) benefits, along with their 6- to 17-year-old children. The fare discounts were allocated using a lottery. Each household in the pilot was randomly assigned to one of three groups, each with equal probability. One group received unlimited free PRT trips, a second group received a 50% discount on all PRT trips, and a third group received no discount. The fare discounts lasted 16 to 19 months for the free-fare and half-fare groups.

    Key Takeaways

    1. The Pilot began with strong enrollment—over 14,000 people. A total of 9,544 adults and 4,928 children enrolled in the Pilot during the three-month open enrollment period. The majority of adult participants were female (72%) and Black (59%). Participants reported taking an average of ten PRT trips per week and spending an average of nearly $30 on public transportation per week at the time they enrolled in the Pilot.
    2. Free fares increased public transit ridership. On average, participants in the free-fare group took 1.48 more trips per week—a 43% increase—compared to those who paid regular price for their trips. In contrast, transit usage among participants who received half-priced fares was not statistically different from those who paid regular price for their trips.
    3. Fare discounts eased financial hardships. Near the end of the discount period—around 15 months into the pilot program—recipients of free fares reported spending $17.09 less per week on public transit compared to participants who paid full price for their transit usage. Participants paying half-priced fares reported spending $5.64 less per week on public transportation than participants who paid full price for each ride.
    4. Among participants who began the study without a job, free fares led to meaningful gains in employment and income. Over the first year and a half of the program, unemployed individuals who received free transit were 6% more likely to secure paid work than those who paid full price. Free-fare recipients also earned nearly $2,850 more—a 28% increase in earnings—compared to participants who covered their own transit costs. These findings suggest free public transit can increase financial stability and employment opportunities for low-income residents in Allegheny County.
    5. The short duration of the fare discounts may have limited their impact on other social and educational outcomes. The study found small and statistically insignificant impacts on healthcare utilization and criminal justice involvement (including appearances in court). Fare discounts had no detectable impact on school attendance among children who attend Pittsburgh Public Schools.

    How DHS Uses This Information

    DHS has used the results from this pilot to inform the design and implementation of a longer-term program called AlleghenyGo, which offers a 50% PRT discount for working-age county SNAP beneficiaries and their children. Click here to learn more about AlleghenyGo.

    Past Reports and Resources

    1. Evaluation of First Year of Pilot Program – Interim Results (May 2024)
    2. Research and Evaluation Plan for Pilot Program (2022)

    Questions or Feedback?

    We welcome your questions and suggestions. To share feedback, you can reach us at DHSResearch@alleghenycounty.us. If you’d like to stay informed, consider signing up for our newsletter. To learn how to use DHS data in your research, please visit our Requesting Data page. Thank you for your time and interest. Your engagement helps shape and improve how we share data that matters.

    Current Information

    The Allegheny County Department of Human Services (DHS) engages clients and others who interact with DHS programs in a variety of ways: regular roundtables/cabinets (e.g., Children’s Cabinet); town halls and community forums; social media (e.g., Facebook and LinkedIn); and the Director’s Action Line (DAL). In 2018, DHS expanded its public engagement strategy to include SMS text messaging (texting), a tool that is convenient for recipients and allows DHS to scale up communication with clients and other Allegheny County residents.

    How does DHS use text outreach? 

    DHS uses text outreach in a variety of ways, including collecting feedback after a service touchpoint, increasing program engagement, recruiting for paid research opportunities, and providing timely alerts. Text messaging has allowed DHS to connect clients to resources at scale, and to solicit feedback from clients who would likely never otherwise have the time or opportunity to share their feedback.

    What data is available?

    The data brief provides more information about the communication strategy and descriptive analytics from 2018 to 2022. The interactive dashboard, which is updated daily, allows users to drill down to individual text campaigns to understand the purpose, the number of messages sent, and the demographics of people who were contacted.

    Terms and Conditions

    This service is used by the Allegheny County Department of Human Services to send you notifications about publicly funded services. You can cancel this service at any time. Just text “STOP” to 987987. After you send the message “STOP” to us, we will send you a reply message to confirm that you have been unsubscribed. After this, you will no longer receive messages from us. If you want to join again, just text “START” to 987987, and we will start sending messages to you again. If at any time you forget what keywords are supported, just text “HELP” to 987987 After you send the message “HELP” to us, we will respond with information about the program. Message frequency varies. Carriers are not liable for delayed or undelivered messages. As always, Message and Data Rates May Apply for any messages sent to you from us and to us from you. If you have any questions about your text plan or data plan, it is best to contact your wireless provider. For all questions about the services provided by this short code, you can contact us at DHS-Research@alleghenycounty.us

    Please view our Privacy Policy here