Background

The Allegheny County Department of Human Services (DHS) regularly collects feedback from community members who use DHS and DHS-funded programs. Collecting and using this feedback demonstrates a commitment to continuous quality improvement, increasing trust among service users. DHS also administers broad-scale research surveys that gather data to help the Department conduct rigorous program evaluations. Recognizing the time and effort required for clients to participate in these activities, and the value of having higher, representative response rates, DHS has a standard practice of providing monetary incentives.  

Key Takeaways  

The data brief discusses the challenges of and solutions to scaling monetary incentives at large organizations, and it provides summary analytics about DHS’s incentive spending from Fall 2020 through December 2024.

  • In Fall 2022, DHS invested in two key partnerships, including a digital gift card platform, that has resulted in collecting more client feedback and human subjects research than ever before.  
  • From 2020 to 2023, the number of clients who were given a gift card for their participation in data collection increased by nearly one order of magnitude each year.  
  • Offering incentives increased participation rates, improved sample representativeness, and reduced the amount of staff time needed for data collection.  
  • While incentives encourage participation with research activities, gift card redemption is largely influenced by the gift card amount; only 21% of gift cards $5 or less are redeemed while 91% of gift cards $30 or more are redeemed.  
  • The top 3 brands for which participants choose to redeem their digital gift cards are Amazon (29.8%), Mastercard (9.5%) and Visa (9.2%).  

Why This Matters and What’s Next

Client feedback helps DHS and its providers identify what services are working well and what are not meeting clients’ needs. Offering incentives increases participation rates, and higher participation rates lead to a more representative dataset to inform public policy decisions. Using technology-based business processes to collect data and process incentives allows DHS to do this at scale across nearly 500 contracted providers and over 200,000 clients served annually. Having extensive and robust feedback from the public ensures that residents are active partners in shaping service systems — and that those service systems are responsive, equitable and reflect the needs and priorities of the community.

Questions or Feedback?

We welcome your questions and suggestions. To share feedback, you can reach us at DHSResearch@alleghenycounty.us. If you’d like to stay informed, consider signing up for our newsletter. To learn how to use DHS data in your research, please visit our Requesting Data page. Thank you for your time and interest. Your engagement helps shape and improve how we share data that matters.

Resources

Overview

This dashboard provides information on individuals who use services from the Allegheny County Office of Developmental Supports (ODS). To best understand the scope and role of ODS services, this dashboard includes data on demographic characteristics, diagnoses and the services and supports used by eligible, registered individuals. To offer a comprehensive view of service involvement for these individuals, this dashboard also includes data on additional human services and supports that falls outside of the ODS direct oversight.

Consistent and effective support requires a knowledge of who is receiving services and an understanding of how recipients use those services. This dashboard supports informed decision-making and collaboration among providers, community partners, policy makers and families by identifying patterns and gaps in service use — both within and between service systems. This information can guide strategic funding and service decisions —ensuring service delivery is responsive, equitable and aligned with the lived experiences of ODS service users. Ultimately, this dashboard has the potential to improve outcomes for service users in Allegheny County.


Dashboard Guide

How to Use the Dashboard

At the top of the dashboard, you’ll find tabs that let you switch between different sections of content. Hovering over visuals will reveal additional details. Some dashboard tabs include filter tools—typically located on either the left-hand or right hand side of the screen—that allow you to explore the data by time period, demographic group or service type. Selecting a specific part of a chart or map may also filter the view of the data on the dashboard. To return to the full view of ODS service users, clear any filters you’ve applied. Many of the visual elements are interactive and built to support user-driven exploration.

Key Features

  • Explore demographics (e.g., age, race, sex assigned at birth) of registered individuals
  • View distribution and types of diagnoses (e.g., autism, intellectual disability)
  • Compare use of ODS services and waiver types
  • Track annual registration counts and geographic distribution across Allegheny County
  • Examine the overlap between ODS services and other public service use, including supports for people without stable housing and those who have mental health treatment
  • Filter by time frame, diagnosis, funding type and municipality

About the Data

This dashboard uses data from the Pennsylvania Home and Community Services Information System (HCSIS) and includes individuals registered with ODS. All individuals have qualifying diagnoses (i.e. intellectual disability (ID), autism spectrum disorder (ASD), a developmental disability (DD) before age 9, or a medically complex condition (MCC) diagnosed before age 22). The dashboard updates monthly. To ensure privacy, we use anonymized records and don’t display data for small groups. Definitions and additional details about waiver types and services are available in the Data and Definitions tab on the dashboard.

Trouble viewing the dashboard below? You can view it directly here.


Questions or Feedback?

We welcome your questions and suggestions. To share feedback, you can reach us at DHSResearch@alleghenycounty.us. If you’d like to stay informed, consider signing up for our newsletter. To learn how to use DHS data in your research, please visit our Requesting Data page. Thank you for your time and interest. Your engagement helps shape and improve how we share data that matters.

Current Information

Background

In the United States, there are barriers to accessing mental health services, especially for Medicaid recipients, who face additional challenges in receiving care compared to their peers who use private insurance. Medicaid recipients often have decreased provider acceptance rates and increased wait times for care. Reimbursement rates can influence the availability and quality of mental health services for these recipients, highlighting the importance of evaluating compensation frameworks and their impact on the access and delivery of mental health services.

The Allegheny County Department of Human Services (DHS) partners with Community Care Behavioral Health (CCBH) to provide behavioral health services for Medicaid recipients. The resources (i.e. report and summary) present a decade (2010-2019) of information, encompassing claims data (i.e. billing and payment records) and rate variations. Analyzing data prior to COVID-19 ensures findings and inferences from the data reflect pre-pandemic conditions only.

What You Need to Know

The report evaluated over 1,100 behavioral health providers and over 90 service codes. The evaluation of reimbursement rates and service availability has identified some relationships between provider responsiveness and payment systems.

  • A 20% increase in Medicaid reimbursement rates resulted in a 3.2% increase in services offered, demonstrating a small yet positive relationship. The increase in reimbursement rates offered a temporary increase in service provisions, but this effect was not sustainable, eventually declining or disappearing within 4-5 years. 
  • Established clients made up more of scheduled visits than new patients during this time of rate and service increases.
  • Larger providers have less challenges in adopting and adapting to rate fluctuations than smaller providers.

Why This Matters and What’s Next

In Allegheny County, Medicaid reimbursement rates are generally lower than Medicare rates. The disparity in these funding mechanisms suggests Medicaid enrollees are less attractive to providers than Medicare recipients. The analysis also suggests rate increases did not offer a sustainable solution for increased access to mental health services. Addressing system-level constraints (e.g. workforce shortages, limited facility capacity) may facilitate development of sustainable and equitable approaches to receiving care. Additionally, continued monitoring and evaluation of the needs of small providers, the disparity between Medicare and Medicaid rates, and the demand for a long-term sustainable strategy for service provisions may be particularly beneficial, as these efforts may be crucial in establishing effective and equitable health care solutions for Allegheny County and the nation.

Current Information

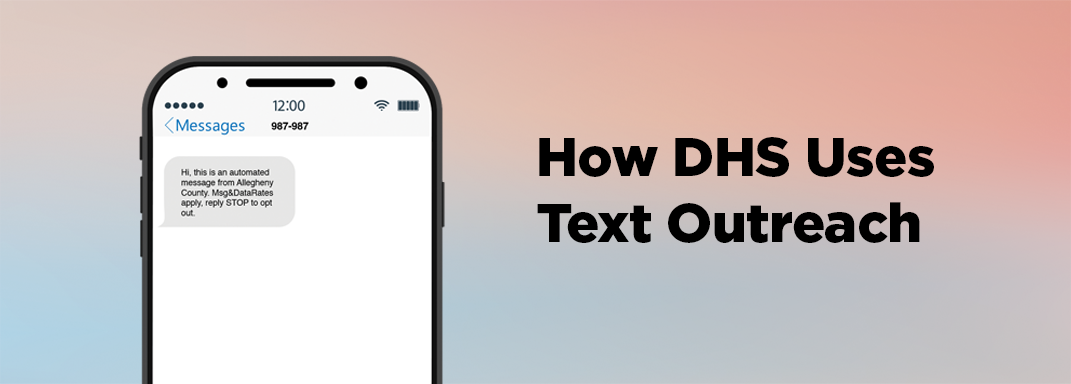
The Allegheny County Department of Human Services (DHS) engages clients and others who interact with DHS programs in a variety of ways: regular roundtables/cabinets (e.g., Children’s Cabinet); town halls and community forums; social media (e.g., Facebook and LinkedIn); and the Director’s Action Line (DAL). In 2018, DHS expanded its public engagement strategy to include SMS text messaging (texting), a tool that is convenient for recipients and allows DHS to scale up communication with clients and other Allegheny County residents.

How does DHS use text outreach? 

DHS uses text outreach in a variety of ways, including collecting feedback after a service touchpoint, increasing program engagement, recruiting for paid research opportunities, and providing timely alerts. Text messaging has allowed DHS to connect clients to resources at scale, and to solicit feedback from clients who would likely never otherwise have the time or opportunity to share their feedback.

What data is available?

The data brief provides more information about the communication strategy and descriptive analytics from 2018 to 2022. The interactive dashboard, which is updated daily, allows users to drill down to individual text campaigns to understand the purpose, the number of messages sent, and the demographics of people who were contacted.

Terms and Conditions

This service is used by the Allegheny County Department of Human Services to send you notifications about publicly funded services. You can cancel this service at any time. Just text “STOP” to 987987. After you send the message “STOP” to us, we will send you a reply message to confirm that you have been unsubscribed. After this, you will no longer receive messages from us. If you want to join again, just text “START” to 987987, and we will start sending messages to you again. If at any time you forget what keywords are supported, just text “HELP” to 987987 After you send the message “HELP” to us, we will respond with information about the program. Message frequency varies. Carriers are not liable for delayed or undelivered messages. As always, Message and Data Rates May Apply for any messages sent to you from us and to us from you. If you have any questions about your text plan or data plan, it is best to contact your wireless provider. For all questions about the services provided by this short code, you can contact us at DHS-Research@alleghenycounty.us

Please view our Privacy Policy here

In May 2022, Allegheny County assembled a taskforce of leaders to reduce intimate partner violence (IPV) through improved coordination, information sharing, training, and implementation of interventions that target both those who use violence and those who are victims or survivors of it.

Historically, the County’s understanding of IPV has been based on national data, which, though useful, fails to capture local nuances that lend greater insight into specific community needs. The county published a report and dashboard to provide more local context to problems of IPV in Allegheny County by describing trends in demographics, human services involvement, and criminal histories among victims and perpetrators of intimate partner homicides (IPH). The report covers January 2017 through September 2022. The dashboard includes more recent information and is updated annually.

The analysis point to a disproportionate impact on individuals who are disadvantaged not only by their gender identity, but also by systemic racial and socioeconomic inequalities. Though IPV has traditionally been framed as an issue related to gender alone, a more intersectional understanding of risk and impact can better inform strategies for effective prevention and mitigation.

Key Findings from Report

  • There were 45 victims (43 incidents) of IPV and IPV-spillover homicides from January 2017 through September 2022.
  • The demographic trends among individuals involved in IPH are similar to those of overall homicides: victims and perpetrators are disproportionately Black, young (aged 25-34) and living in high-need areas. Black women represent the highest proportion of victims (37%, n=16), while Black men constitute the highest proportion of perpetrators (56%, n=23).
  • Unlike homicides at large, IPH victimization disproportionately impacts women: 63% of victims of IPH are women.  While IPH accounted for roughly 7% of all homicides from January 2017 through September 2022, they made up 30% of all homicides with female victims.
  • Both victims and perpetrators of IPH had high rates of involvement in human services.  74% of perpetrators had prior involvement with child welfare, publicly funded behavioral health, or homeless and housing systems.
  • 58% of victims had prior involvement with child welfare, publicly funded behavioral health, or homeless and housing systems.
  • Across all gender, race and role categories, about 53% of individuals involved in IPH – 47 of 88 – had criminal justice involvement at some point prior to the homicide incident: 63% of perpetrators (27 of 43) and 44% of victims (20 of 45). Among perpetrators with criminal justice involvement, both Black and White men had higher rates of involvement than either Black or White women.
  • Roughly 24% of all IPV perpetrators had indicators of IPV history in either the criminal courts or child protection system. This is likely an undercount of true IPV history, as data limitations, legal restrictions and underreporting make identification of non-fatal IPV in the data difficult. Among those with domestic violence related criminal cases, the majority occurred in the 18 months prior to the homicide incident.

Read more about the county’s IPV work here.


Allegheny County Department of Human Services (DHS) developed these publicly available, interactive dashboards in collaboration with resolve Crisis Services, the County’s provider for the 24-hour, 365-day mental health crisis service provided free to all Allegheny County residents.

These dashboards provide information about:

Crisis Calls: Overview of call volume to resolve Crisis Services through 988 Suicide & Crisis Lifeline and resolve’s 24-hour hotline 1-888-7-YOU-CAN (796-8226), consumer wait time to reach call clinician, abandoned call rate, and demographics of person-in-crisis who received call services. Aggregate call information is from April 2021 to present and is updated monthly. Demographic information is available from March 2023 to present and is updated monthly.

Mobile Team Dispatches: Overview of mobile team dispatch volume, consumer wait time, reasons for mobile team dispatch, dispatch rate by neighborhood, and demographics of people-in-crisis who received mobile interventions. Information is available from September 2023 to present. Data updated monthly.

Police Involvement: Percentages of calls and mobile team dispatches with police involvements. Information is available from September 2023 to present. Data updated monthly.

Current information

The Allegheny County Department of Human Services (DHS) funds programs to assist young adults who are transitioning out of the child welfare system (also known as transition-aged youth) to secure employment, education, housing, behavioral health services, financial advice and more. Despite these service offerings, transition-aged youth have higher rates of homelessness, substance use, mental health challenges and incarceration, as well as lower rates of high school graduation compared with people who were not involved with the child welfare system. While targeted services are important, some human service needs result from poverty, which can be mitigated by providing direct financial assistance.

What is this report about?

In the summer of 2023, DHS launched a direct cash support program called Cash Assistance for Allegheny Young Adults (CAAYA), which provided a one-time payment of $4,000 to young adults, ages 18 through 22, with a history in the child welfare system, who were experiencing homelessness or were young parents who had an open case with Allegheny County’s child welfare office. In this report, we present a mixed-methods approach to evaluating the impact of CAAYA, including longitudinal surveying, a quasi-experimental analysis of administrative data in the Allegheny County Data Warehouse, and semi-structured interviews with cash recipients.

What are the takeaways?

  • CAAYA recipients demonstrated significant financial need. At the launch of the program, only 35% reported being currently employed and only 29% reported being in school either full-time or part-time. Those who had some form of formal employment in the 12 months before the program had mean annual earnings of $10,174. Twenty-eight percent had one or more children.
  • CAAYA recipients also lacked financial support within their community. Two-thirds of recipients reported not knowing anyone who would lend them $500 in a time of crisis.
  • Overall, the program encouraged about 100 individuals to open a bank account. Seventy-five percent (n = 774) of recipients chose to receive the money via bank account transfer and 25% via a virtual gift card.
  • Recipients used the cash assistance quickly. On average, $2,769 of the $4,000 was spent within the first month.
  • Car-related expenses ranked as the number one item for planned expenditures, and there was a 41% relative increase in car ownership three months after receiving the money.
  • The program improved self-reported well-being after receiving financial assistance, but the effects faded in the subsequent months.
  • CAAYA recipients increased their use of mental health outpatient therapy by 7% compared to a control group of individuals who were narrowly ineligible for the program. There was no change in utilization of crisis and inpatient services. In contrast to self-reported well-being, the program’s impact on usage of outpatient mental health services persisted for at least eight months after receiving funds.

How is this report being used?

As a result of this program, we are exploring additional opportunities to leverage cash assistance with this population to increase engagement in holistic supports and services. We are also considering longer-term programs with more frequent, smaller payments to targeted populations.  For future programs, we hope to receive state waivers for the impact of cash assistance on public benefits, especially if a program is designed to include ongoing payments.

For other local governments or providers who are considering cash assistance programs, we hope this report serves as a resource for program design and evaluation. Local governments should note that the success of the CAAYA program would not have been possible without our partner organizations. Trust in government significantly impacts the accessibility of services, particularly for marginalized communities. When first hearing about the cash assistance, many individuals who were eligible to receive the money thought that it was a scam. This skepticism was eased by having multiple trusted intermediaries ensure that it was a real program and that they should apply.

Allegheny County Department of Human Services developed these dashboards to provide information to the community about violence trends in Allegheny County and the City of Pittsburgh.

What is this dashboard about?

The dashboard contains information about all homicides in the county and city (as reported by the county’s medical examiner) and contains a link to the Pittsburgh Bureau of Police’s dashboard showing shootings within the City of Pittsburgh. The dashboard shows trends in homicides, including trends in demographic data for victims and trends in homicide locations. The dashboard also shows information on human service, physical and behavioral health, income supports and justice involvement for the victims prior to their death.

What data is available?

Data on homicides is available through the Allegheny County Medical Examiner’s office. It is available from 2007-present and is updated monthly. Data on program involvement (including prior justice involvement) comes from Allegheny County’s data warehouse, which integrates information from more than 20 distinct sources. Read more about the county’s data warehouse here.

Current information

Since 2016, the Allegheny County Department of Human Services (DHS) in Pennsylvania has utilized the Allegheny Family Screening Tool (AFST), which assists child welfare call screening caseworkers in their assessment of general protective service (GPS) referrals regarding potential child maltreatment.

What is this report about?

This report reviews the research evidence on algorithms in child welfare, specifically focusing on the causal impacts of the AFST and comparable predictive risk models (PRMs). It begins by summarizing the influence of these tools on child welfare decisions. The report then explores the discrepancies between perceived and actual effects of these models, highlighting the importance of bridging the gap between perception and reality to alleviate concerns and maximize the effectiveness of these tools.

What are the takeaways?

The impacts of predictive risk models in child welfare must be compared with alternative approaches to augmenting call screening caseworker decision-making. Traditional risk assessments in child welfare have been largely manual, prone to inconsistencies, and often omit critical information. Before implementing the AFST, Allegheny County did not employ any structured risk assessment.

The main conclusions from recent research on the AFST are:

  • The AFST changed the composition of investigated referrals. The introduction of the AFST decreased the probability of investigation for referrals with low risk of removal and increased the probability of investigation among referrals with high risk of removal. The introduction of the AFST also reduced the racial gap in investigation rates, particularly among higher risk referrals.
  • The AFST is reducing, not increasing, racial disparities. Researchers found that the introduction of the model reduced racial disparities in investigation rates across AFST scores, although the size and precision of the reduction varied. The AFST reduced the racial disparity in investigation rates for the highest risk referrals by 83%, from 10.6% to 1.8%. The researchers estimated that the AFST reduced the Black–White gap in removal rates of screened-in referrals by 73%, from 4.3% to 1.2%.
  • Screeners use the algorithm but with caution. Researchers found that call screening case workers are integrating information from the AFST effectively, aligning their decisions more closely with predicted removal risk compared with the period before the tool’s introduction. The tool is seen as a helpful source of additional information rather than a replacement for professional judgment. 

How is this report being used?

The application of algorithms to support decision-making, especially in sensitive areas like child welfare, mandates high transparency. It is critical that the complexities of predictive risk models are communicated clearly to all stakeholders to maintain trust and prevent misuse. DHS is committed to keeping the public informed about the use and impact of algorithms at the Department and draw upon current research to shape the implementation of these tools in the field.

Read more about AFST here.

Reports

In 2018, the Allegheny County Department of Human Services entered into a formal data use agreement (DUA) with UPMC Health Plan. The purpose of the agreement is to improve care for shared clients. The report — Leveraging Data to Support Health Equity in an Integrated Delivery and Finance System — details how UPMC leveraged data sharing, spotlights associated outcomes and suggests future directions for data practices in healthcare settings.

Social determinants of health (SDOH) are non-medical factors—such as housing, food security, and social support—that significantly affect health, well-being and quality of life. Because these factors often remain unknown within healthcare systems, the University of Pittsburgh Medical Center (UPMC) and the Allegheny County Department of Human Services (DHS) integrated healthcare and human services data to bridge the gap between medical and non-medical information. Their collaboration in data-sharing supports holistic, equitable care and underscores the role of informed system design in improving health outcomes.

View the report to learn how collaboration between DHS and UPMC strengthen social supports and advance health equity.

Key Takeaways:

  1. Needs Identification: Screening found unmet social needs for more than one-third of women.
  2. Connecting people to support: Providers linked over 700 individuals with essential social services and support.
  3. Cross-sector impact: Coordination across systems identified 281,000 shared clients and resulted in enhanced care management for 100 adult Medicaid/Special Needs Plan members.

Questions or Feedback?

We welcome your questions and suggestions. To share feedback, you can reach us at  DHSResearch@alleghenycounty.us. If you’d like to stay informed, consider  signing up for our newsletter. To learn how to use DHS data in your research, please visit our  Requesting Data page. Thank you for your time and interest. Your engagement helps shape and improve how we share data that matters.

In Allegheny County, a network of shelters provides temporary places to stay for people experiencing homelessness. Allegheny County’s emergency shelter network includes facilities that serve only adults and others that offer spaces to families with children or other dependents (family shelters).

This data brief focuses on the group of approximately 598 people in 184 households that enrolled in one of six family shelters at least once from April 2022 through March 2023. People are eligible for family shelters if they are 1) an adult with a minor child(ren) or a child over 18 years old still enrolled in high school, 2) a woman or couple without a minor child where the woman is in her third trimester of pregnancy, or 3) a couple unable to separate or parent with an adult child where one is caregiving for the other.

See the related data briefs, “People Using Adult-Only Emergency Shelters in Allegheny County” and “People Experiencing Unsheltered Homelessness in Allegheny County for descriptions of other people served in the homeless system

  • Ninety percent (N=165) of heads of household who used family shelters were female and Black individuals were over-represented – 77% of heads of households were Black, but Black individuals only make up 14% of the county. Most households (71%) consisted of an adult female head of household and one or more children. Forty-nine percent of children (N=179) were age 5 or younger at the time they entered a family shelter. An additional 35% were ages 6 through 12 and 16% were ages 13 through 17.
  • Most families had not recently used the shelter system and only stayed once. 84% of families only used shelter once during this period and only 6% had used a shelter or County housing program in the year prior to their first stay.
  • Although half of families stayed in shelter for more than two months, the largest group of families exited within a week of entering. Seventy-nine percent (N=153) of all stays resulted in households exiting to stable housing, which includes a County housing program (32%), housing with family or friends (27%), or an owned or rented property (19%). An additional 19% exited to another shelter.
  • Income is limited for heads of household using family shelters. 70% (N=129) of heads of household self-reported income from any source, with an average monthly income of $923. Additionally, DHS was able to access Pennsylvania Labor and Industry information for 171 individuals in this cohort (93%). Of these heads of household, 47% (N=81) had earnings, with an average monthly income of $1,243.
  • About a third of Medicaid-enrolled heads of household used behavioral health services, most of which were mental health outpatient services. The most common diagnosis was acute stress disorder (30% of people with a diagnosis), a short-term mental health condition that can occur within the first months after experiencing a traumatic event.
  • Asthma was the most common chronic condition for Medicaid-enrolled children using shelter and the second most common for heads of household. Asthma rates for both are twice as high as those in the general Medicaid-enrolled population in the County
  • Fifteen percent of families using these shelters had an active child welfare case in the year prior to their stay. This could indicate the need for additional support and safety nets within the child welfare system or as families transition out of it.

Emergency shelters are meant to be short-term accommodations for people experiencing a crisis. The County’s goal is to ensure that shelter stays are rare, brief and non-recurring.  The County is working with shelter staff and other housing providers to support client moves to stable housing when possible, with the goal of improving their overall outcomes and ensuring that short-term beds are available when people need them. 

In its responsibility for administering publicly-funded human services, Allegheny County Department of Human Services (DHS) plans for the allocation of more than $1B in areas that span behavioral health, children and families, aging, housing and homelessness, and intellectual disability and autism services.

How does DHS plan its allocation of resources?

DHS planning activities are ongoing and iterative. They include:

What is the County Human Services Plan?

The County Human Services Plan consolidates planning requirements for categorical components of the Human Services Block Grant, including Mental Health Community Base-Funded Services, Behavioral Health Services Initiative (BHSI), Intellectual Disabilities Community Base-Funded Services, Act 152 of 1988 Drug and Alcohol Services, Homeless Assistance Program Funding, and Human Services Development Funds. It is submitted annually to the PA Department of Human Services, 60 days after the agency releases its annual bulletin (usually in the summer).

What is the Needs-Based Plan and Budget?

The Needs-Based Plan and Budget articulates Allegheny County’s priorities, planned services, and resource needs for serving children and families – in particular those children and families who are involved with, or at risk of involvement with, the child welfare and juvenile justice systems. It is submitted annually to the PA Department of Human Services, Office of Children, Youth & Families (the budget narrative submission deadline is August 15th every year).

State Fiscal Year (SFY) 2027-2028

Older plans:

What is the Area Agency on Aging Strategic Plan?

The Allegheny County Area Agency on Aging (AAA) is part of a nationwide aging network led by the U.S. Administration on Community Living and the Pennsylvania Department on Aging (PDA). Every four years, PDA requires each of the Commonwealth’s fifty-two (52) Area Agencies on Aging to submit an action plan for the following four years. This Four-Year Plan considers the demographic trends of the region, the changing needs of the consumers, and the current services provided by the Allegheny County AAA.

Additionally, the Allegheny County AAA may release other strategic documents, including yearly program updates, budget prospectuses and annual reports.

Community Services Needs Assessment & Strategic Plan

Allegheny County DHS is the designated community action agency for the receipt of the County’s (outside the City of Pittsburgh) Community Services Block Grant (CSBG) funds. CSBG is a federally funded block grant from the US Department of Health and Human Services, Administration for Children & Families, Office of Community Services that supports services aiming to alleviate the causes and conditions of poverty in under resourced communities. CSBG recipients are required to conduct a needs assessment and develop a strategic plan no less than every 5 years.  

Housing and Homelessness

Allegheny County DHS, through its Office of Community Services, is the designated Infrastructure Organization and United Funding Agency for the Allegheny County Continuum of Care (CoC) – the network of services and stakeholders engaged in making homelessness rare, brief and non-recurring. Starting in 2016, the CoC underwent a community planning process to create its strategic plan. The strategic planning process is summarized in Preventing and Ending Homelessness – Community Strategic Planning Process. Principles guiding the strategic plan can be found in the Guiding Principles: Allegheny County Plan to Prevent & End Homelessness. The working board of the CoC, the Homeless Advisory Board (HAB), voted to accept the plan on July 25, 2017.

Opioid Settlement Funding

Other plans

    At the Allegheny County Department of Human Services (DHS), we work with more than 400 community organizations to keep children and older adults safe from abuse and neglect, connect them to effective mental health and substance use treatment, provide housing for those without shelter and more. As stewards of more than $1 billion in public funding, we constantly scrutinize the programs and services we fund to ensure that they are most effectively helping clients make measurable progress toward their goals. We pay close attention to the data, including client feedback and surveys, and use these data to determine when it’s in clients’ best interest to modify existing programs or launch new ones. Recently, we have been increasing our commitment to the use of randomized pilots to measure the effectiveness of various strategies and determine how to make the best use of available resources. In keeping with our values of transparency and the appropriate use of data for decision-making, we want to share our thinking behind the use of pilots as an effective tool to further the Department’s goals and values while improving client outcomes.

    What are randomized pilots?

    When we ask, Was this program effective?, We want to know if client outcomes are better for program participants when compared to the outcomes of others not involved in the program. There are various ways to make this comparison. For example, we can compare client status before and after the program or we can compare their outcomes to clients who chose to not participate in the program. The weakness of both of these approaches is their reliance on the assumption that the groups are similar, i.e., on average, they would have performed the same if neither had received the intervention. Thus, we are left wondering, “How can we distinguish the program impact from the effects of time or characteristics of the participants?” Randomized pilots solve this problem by breaking the link between characteristics that could drive differences between groups and the program itself. In a randomized pilot, participants are assigned to different programs or policies randomly, based on the equivalent of a coin flip. These methods are standard practice in medical and drug trials to measure the effectiveness of health interventions with confidence; in recent years, they have become more popular with governments entities, nonprofit organizations and businesses.

    Why start with a pilot?

    Many organizations have highlighted the value of randomization (see here and here for examples). Rather than rehash their points, we expand upon three DHS core values that are supported by the use of pilots.

    • Accountability and Transparency: Too often, the performance of government-led initiatives or strategies are unclear, making it impossible to measure progress or demand accountability. Change, if it does occur, is not based on credible data nor connected to measurable outcomes. Without clear information, program continuation or termination may be based on subjective decisions that might be inaccurate. In contrast, DHS wants to be held accountable and to ensure that we are funding programs that measurably improve the outcomes of the clients who rely on us for critical support, services and resources. We seek to provide clear feedback to ourselves and our stakeholders, demonstrating either that our investments are producing their intended outcome(s) and that money is being spent effectively or that the program needs to be modified or even ended. Randomized pilots promote this accountability and transparency because they are simple to understand, analyze and report on.
    • Betting boldly: Pilots allow us to bet on new, unproven or controversial solutions without committing to expensive or unproven investments that don’t produce results. By getting clear data on performance of new interventions, we can make informed decisions that are in the best interest of those we serve. At DHS, pilots will never be used to generate a known answer to a question or to withhold resources for an intervention clients would otherwise be entitled to receive (e.g., publicly funded childcare subsidies).
    • Continuous improvement: Given the complexity and range of the problems we face—from the opioid epidemic to community violence—we need to use every tool at our disposal to make progress. In government, as in any endeavor, it is hard to improve without feedback. Pilots are a key part of a continuous quality improvement cycle that starts with asking whether programs are effective and how they could be better. They guard against poor decision-making by providing data on an initial investments before making longer term decisions about funding and large-scale program launches.

    Pilot ethics

    Earning and keeping clients’ trust is essential for our work. In line with our strategic initiatives, work on algorithms and funding decisions, we will continue to strive for transparency and community engagement as we develop pilots and report on their results and ultimate funding decisions. Our commitment to transparency and
    protections for clients includes:

    • Seeking participants’ informed consent for sharing data and voluntary participation in all pilots.
    • Targeting studies to individuals and neighborhoods that can benefit from the solution.
    • Compensating clients for completing surveys and other forms of participation.
    • Protecting participants’ data—study data will always be reported only in aggregate form, protecting the individual identity of all participants.

    When partnering with outside academics who propose to analyze and report on the implementation and outcomes of a pilot, they will be asked to submit their analysis plan to their institutions’ Institutional Review Board (IRB), thus minimizing the risk of unintended negative outcomes and ensuring informed consent. In any case, when we implement and analyze the results of a pilot to inform decisions about launching the program, we commit to publishing the results and decisions on our website. We welcome suggestions about potential interventions where a randomized pilot can increase our understanding of the specific intervention and of the kind of interventions community members are interested in testing (contact us at DHS-Research@alleghenycounty.us). Randomized pilots have the potential to increase our data-informed program decisions and improve the quality and relevance of program strategies; they will also challenge us to make the best use of our resources. We look forward to the challenge and hope you’ll join us as we expand this continuous quality improvement strategy. We’ll update this website as we begin new pilots and report on interim and final results.