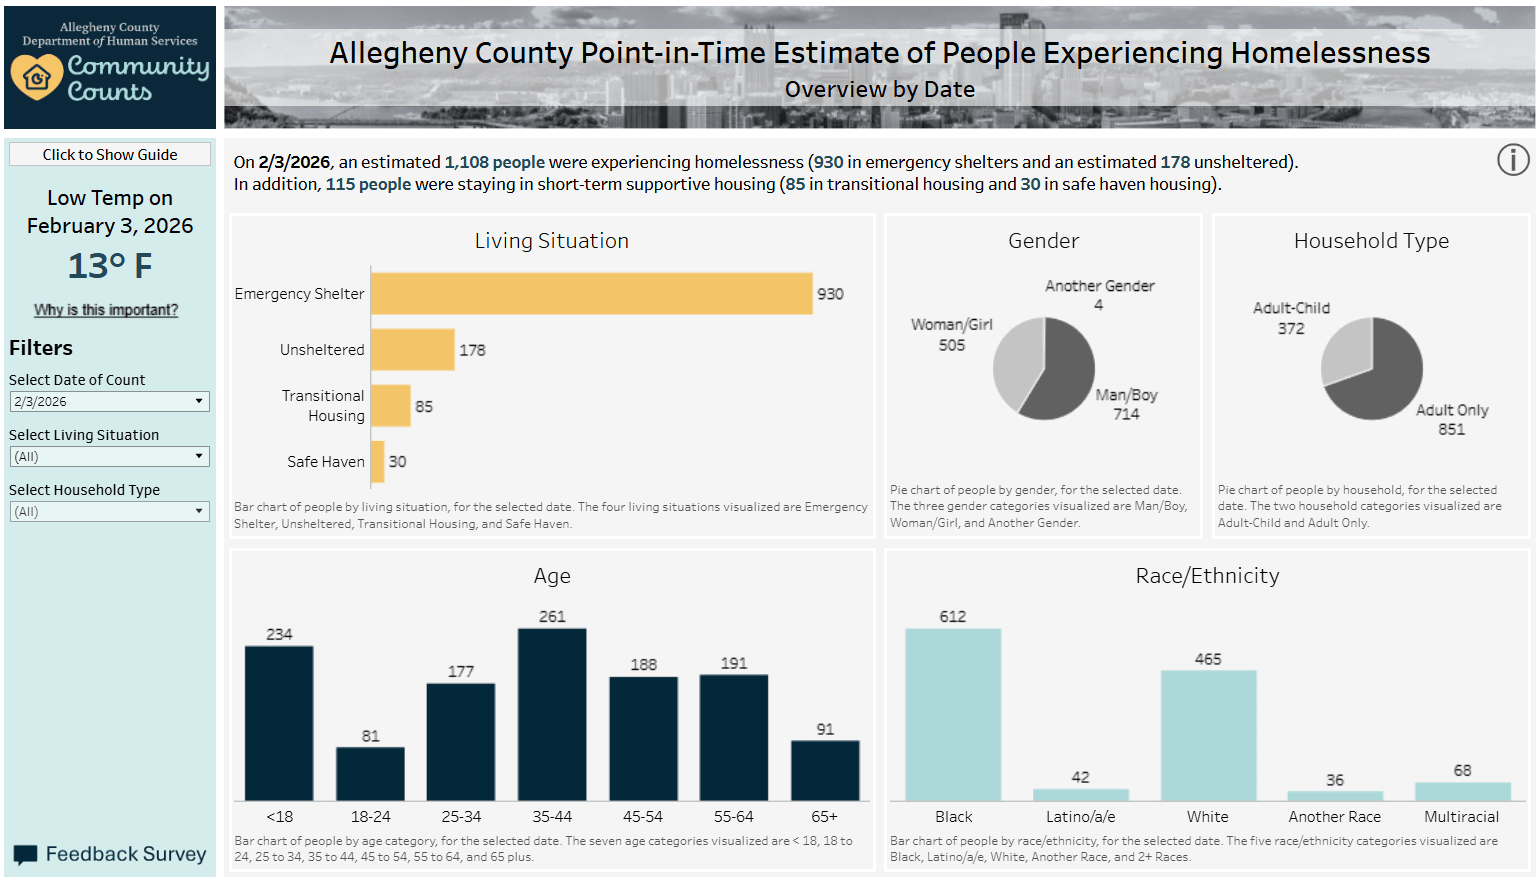
As required by the US Department of Housing and Urban Development (HUD), Allegheny County conducts an annual Point-in-Time count of individuals experiencing homelessness on a single night. The count identifies individuals who are sheltered (residing in emergency shelters), unsheltered (residing in places not meant for human habitation), or participating in a short-term housing program (bridge and safe haven).
2026: A New Approach
In 2026, Allegheny County launched “Community Counts,” a reimagining of this annual effort that marked the start of a new, volunteer-driven approach to the unsheltered estimate. The new methodology emphasizes geographic coverage using statistically valid sampling and can be replicated to allow for more accurate year-over-year trends.
Due to a major snowstorm at the end of January 2026, Community Counts was delayed by one week and conducted from the night of Tuesday, February 3rd into the morning of Wednesday, February 4th. The overnight low temperature was 13°F and the region remained snow-covered. Despite the weather, about 270 volunteers joined the effort.
Key Takeaways
Most (84%) of Allegheny County’s total estimated homeless population on the night of the count were in shelter as opposed to staying outside. Although the County had sufficient capacity to serve more people in shelter, some people remained outside despite the frigid temperatures and snow. Individuals may stay outside for many reasons, including lack of alignment between available shelter and individual needs (e.g., location and accessibility), concerns related to safety or prior negative experiences in congregate shelter settings, behavioral health challenges, or barriers related to partners, pets and/or personal belongings. Street outreach teams continue to work with these individuals to build trust over time, understand barriers to coming indoors, and, when they are ready, provide connections to services.
This year’s estimated unsheltered population of 178 people (all adults) is a new baseline. Using the same methodology next year will allow us to begin to compare year-over-year trends.
The unsheltered population appears to have been concentrated in the same general regions within the County as last year (South Side, South Hilltop, Homewood, the Central Business District and North Side), but in some cases, shifted within those areas.
Abandoned houses/buildings and tents/temporary shelters were the most common unsheltered sleeping locations. Twenty percent of those counted as unsheltered had an unknown sleeping location as they were not yet bedded down when surveyors observed or attempted to interview them.
We have more to learn about where people are unsheltered. Surveyors identified a small number of people experiencing unsheltered homelessness outside of known areas, even with a simple random sample. The research team is exploring ways to stratify next year’s random sample to reflect that some areas and types of places are less likely to have people sleeping unsheltered.
Volunteers had positive experiences and good ideas for next year. In a feedback survey, 90% of respondents said they would volunteer again next year and were likely to recommend the event to a friend (average score eight out of 10). For next year’s Community Counts, we plan to enhance training, improve survey area navigation, provide additional supplies to hand out, and add at least one hub so that the number of teams is capped at 15 per hub.
We welcome your questions and suggestions. To share feedback, you can reach us at DHSResearch@alleghenycounty.us. If you’d like to stay informed, consider signing up for our newsletter. To learn how to use DHS data in your research, please visit our Requesting Data page. Thank you for your time and interest. Your engagement helps shape and improve how we share data that matters.
Unsheltered homelessness refers to a situation in which an individual is living in a place not meant for human habitation, such as on the street, in an encampment, or in an abandoned building. Experiences of unsheltered homelessness vary; i.e., episodes may be intermittent or continuous, short or long. Some individuals move back-and-forth between unsheltered and sheltered situations.
We have created three public-facing dashboards that include information about unsheltered homelessness in Allegheny County. Each dashboard uses a different data source and thus presents a distinct way of thinking about and understanding this issue in our region.
The unsheltered tab of this dashboard displays weekly counts of street outreach clients with recent stays outside, from 2022 to present.
This dashboard uses street outreach program data from the Homeless Management Information System (HMIS).
Use this dashboard to see trends over time (including seasonal changes) in the number of street outreach clients whose most recent living situation was an unsheltered one.
This dashboard cannot tell you the number of people unsheltered on any given night and it only captures information on clients who are enrolled in a street outreach program that uses HMIS. Some unsheltered individuals do not want to engage with outreach staff; others are enrolled in programs that do not use HMIS. Additionally, while the data refresh every week, the dashboard considers recorded living situations up to 30 days prior and cannot provide an “as of today” snapshot.
This dashboard shows visible tent encampments in Downtown Pittsburgh and riverfront trails, updated weekly, from 2023 to present.
This dashboard uses data from an observational survey regularly conducted by ACDHS staff who typically cover the route on bicycle.
Use this dashboard to see trends over time in the number of visible tents and makeshift structures in Downtown Pittsburgh and riverfront trails.
This dashboard does not calculate the actual number of people using a tent or structure. One tent/structure may house one or more people. It may also be vacant, shared, borrowed or used for storage. The data collection route is limited to specific parts of Downtown Pittsburgh and riverfront trails and does not cover all of Allegheny County. It does not include data on other encampments that may be hidden from public view but known to ACDHS or other outreach providers.
The unsheltered estimate uses survey data collected on or just after the night of the count. In 2026, we launched “Community Counts” to mark the reimagining of this annual effort toward an approach that will allow for more accurate year-over-year trends.
Use this dashboard to see an estimate of the number of people sleeping unsheltered on a single night and how that compares to the number of people staying in shelter or other short-term housing programs. Using the available filters, you can also see basic demographic information (age, race/ethnicity, gender) for the estimated unsheltered population.
These data are limited to one night each year (always in winter). The methodology for the unsheltered count has changed over time, which has made it difficult to accurately compare year-over-year trends. But the newly implemented methodology, which is standardized and replicable, now allows for such comparisons beginning with the 2026 count.
Questions or Feedback?
We welcome your questions and suggestions. To share feedback, email us at DHSResearch@alleghenycounty.us. If you’d like to stay informed, consider signing up for our newsletter. To learn how to use ACDHS data in your research, please visit our Requesting Data page. Thank you for your time and interest. Your engagement helps shape and improve how we share data that matters.
Interpersonal violence is a complex, multifaceted problem shaped by individual, social and structural factors. Two prominent forms of interpersonal violence are Intimate Partner Violence (IPV)—any act of physical, psychological or emotional abuse between intimate partners—and community violence—serious acts of violence (including fights, assaults and shootings) between unrelated individuals who may or may not know one another. While IPV and community violence share underlying drivers and often reinforce one another, current interventions do not account for these connections in their design or implementation. Overlooking these shared risk factors and interactions may result in missed opportunities for effective and critical integrated interventions.
Newly available data in the Allegheny County Data Warehouse now make it possible to examine the intersection of IPV and community violence at the individual level. With these data, we can identify who faces the highest risk, understand how multiple forms of violence occur among the same individuals, and design more precise person-centered interventions that reflect these overlapping dynamics. This approach allows us to address shared risk factors directly and strengthen integrated cross-system prevention strategies. We invite you to review the data brief to learn about the intersection of IPV and community violence in Allegheny County.
Key Takeaways
Allegheny County interpersonal violence data from 2021 through 2024 reveal:
IPV history is common in homicide cases: One in five homicide victims or perpetrators had a documented history of IPV (including both indicated and confirmed IPV cases).
Recent IPV often precedes fatal incidents: Nearly half of homicide victims or perpetrators with a documented IPV history had experienced an IPV-related event within one year before the fatal incident.
Co-exposure to IPV and gun violence signals high system involvement: Individuals exposed to both IPV and gun violence had homelessness and substance use treatment rates more than three times the County average and child welfare involvement at four times the County rate.
Structural inequities shape who experiences IPV and gun violence: Black men and women experienced both IPV and gun violence at disproportionately high rates relative to their share of the County population, with geographic concentration in historically disinvested neighborhoods.
Current intervention approaches may miss overlapping risk across types of violence: Many individuals charged with IPV had prior non-IPV criminal involvement, highlighting the need for cross-system strategies that address broad behavioral, environmental and structural drivers of harm.
How the County Uses This Information
We use IPV and community violence data to inform and strengthen our strategy to reduce IPV and community violence in the County. This strategy includes the following elements:
Conducting coordinated reviews of high-risk cases: Convene weekly cross-system reviews of individuals arrested for IPV offenses who are at high risk of causing serious harm, designed to support the identification and delivery of targeted and timely interventions.
Identifying limitations of current intervention approaches and legal system responses: Individuals with a history of community violence may continue acts of IPV despite repeated legal sanctions, indicating that reliance on Protection from Abuse orders (PFAs), criminal charges and battering intervention programs alone may not drive meaningful behavior change.
Advancing community‑based integrated prevention approaches: Expand and strengthen prevention strategies that reduce reliance on formal systems often distrusted by communities affected by systemic inequities; apply Community Violence Reduction Initiative (CVRI) strategies (e.g., credible messengers, conflict mediation, non-clinical cognitive behavioral approaches) to engage individuals at high risk and address the shared drivers of both IPV and community violence.
What’s Next
The County will continue to:
Leverage data to guide improved strategy and investment: Strengthen prevention strategies by grounding them in current data and evidence-based practices aimed at filling gaps in current intervention models that support community health and safety.
Expand and enhance integrated interpersonal violence prevention approaches: Align IPV and community violence strategies by drawing from each to strengthen the other; equip practitioners to recognize patterns of harm, assess risk and engage individuals across contexts; and create additional pathways for engagement and behavior change beyond formal systems
These efforts reflect ACDHS’s commitment to advancing integrated data-informed approaches that reduce harm and support the health and well-being of all Allegheny County residents.
Questions or Feedback?
We welcome your questions and suggestions. To share feedback, you can reach us at DHSResearch@alleghenycounty.us. If you’d like to stay informed, consider signing up for our newsletter. To learn how to use DHS data in your research, please visit our Requesting Data page. Thank you for your time and interest. Your engagement helps shape and improve how we share data that matters.
In the last eight years, the number of Americans experiencing homelessness in the United States has increased by 40%, even as the supply of subsidized housing has doubled. Research shows that housing programs effectively support housing stability. However, system-level outcomes depend on whether housing reaches people likely to exit shelter quickly or those likely to experience longer-term housing instability. Systems that prioritize people with shorter expected stays reduce homelessness less than when they prioritize people facing longer-term instability. Using administrative data from Allegheny County, this policy brief and working paper examine how often housing does not reach those with the greatest need, identify and characterize those who do not receive services, and outline how to recognize these individuals before their homelessness becomes long-term.
Key Results
Using administrative data from Allegheny County, we have developed a predictive model that identifies—at the time of shelter entry—individuals likely to experience an extended shelter stay.
Most shelter residents exit shelter on their own within weeks after starting their shelter stay.
Among the highest-risk individuals flagged by the model, over 40% go on to experience extended homelessness—over three times the baseline rate.
Allocating housing to individuals or families at the highest risk of prolonged shelter stays would prevent approximately 2.4 times more shelter days per unit than allocating to the average shelter resident.
Making housing allocations based on the predictive model rather than current federal prioritization criteria would prevent 120% more shelter days.
Shifting from retrospective to prospective targeting could substantially reduce overall homelessness without expanding the subsidized housing supply.
Why This Matters and What’s Next
Homelessness remains difficult to solve. These data highlight a core challenge: most individuals resolve occurrences of homelessness quickly, while housing supports take time to deploy.
Without thoughtful allocation, resources do not reach people with the greatest need. Allegheny County continues to develop approaches that prioritize resources for individuals at highest-risk. This principle already guides ACDHS programs such as 500 in 500 and the Allegheny Housing Assessment, which have successfully prioritized individuals for housing in times of acute need.
Questions or Feedback?
We welcome your questions and suggestions. To share feedback, email us at DHSResearch@alleghenycounty.us. If you’d like to stay informed, consider signing up for our newsletter. To learn how to use ACDHS data in your research, please visit our Requesting Data page. Thank you for your time and interest. Your engagement helps shape and improve how we share data that matters.
This page presents data on opioid use disorder, overdose trends and treatment engagement in Allegheny County, drawing on available data covering through 2023 and early 2024. The content focuses on patterns of engagement with medications for opioid use disorder (MOUD) and describes how connection varies across populations, service settings and providers. We invite you to explore this page and the report to better understand recent trends and system-level patterns in Allegheny County.
Key Takeaways
OUD remains widespread. Opioid use disorder affects about 5% of Allegheny County residents each year, yet many people who use opioids outside medical guidance do not receive active treatment.
Fatal overdose disparities have grown. Recent trends show widening racial inequities in overdose deaths, with Black residents dying at much higher rates than White residents.
Treatment engagement differs by race among Medicaid enrollees. Analysis of Medicaid claims shows that White enrollees engage in OUD-related behavioral health services and connect to medications for opioid use disorder (MOUD) at higher rates than Black enrollees.
MOUD connection coincides with lower fatal overdose rates. Among Medicaid enrollees who engage in OUD services, those who connect to MOUD shortly after service initiation experience lower subsequent fatal overdose rates than those who do not.
Despite the association between MOUD connection and lower overdose risk, many individuals who engage in OUD services do not connect to MOUD. Connection rates remain below 40% and vary by service type and provider.
What’s Next
Since 2023, Allegheny County—like much of the nation—has experienced a decline in fatal overdoses (Click here to explore overdose trends in the county). Building on this progress, the County remains focused on further reducing overdose deaths and mitigating the harms associated with opioid use disorder. The report describes multiple initiatives supported by opioid settlement funds that aim to strengthen treatment access, recovery supports, harm reduction, prevention and innovation. Examples include: mobile MOUD sites, MOUD via telehealth, warm handoffs from emergency departments, recovery and low-barrier housing, syringe service programs, youth prevention supports, contingency management and wastewater monitoring.
Together, these investments reflect a coordinated, cross-system approach to the work ahead—expanding pathways into treatment, lowering barriers to sustained care, and adapting to an increasingly volatile and dangerous drug supply. To remain informed on how Allegheny County uses opioid settlement funds and to learn about related initiatives, visit the Allegheny County Opioid Settlement Projects page.
Questions or Feedback?
We welcome your questions and suggestions. To share feedback, you can reach us at DHSResearch@alleghenycounty.us. If you’d like to stay informed, consider signing up for our newsletter. To learn how to use DHS data in your research, please visit our Requesting Data page. Thank you for your time and interest. Your engagement helps shape and improve how we share data that matters.
Across the U.S., cities are facing increasing numbers of people experiencing homelessness. Meanwhile, an inadequate supply of deeply affordable housing has made it nearly impossible for individuals and families to move out of the shelter system.
Allegheny County’s 500 in 500 initiative responded to this needs gap with urgency, coordination, flexibility and creative problem-solving. County and City government, housing authorities, nonprofit organizations, foundations, developers and advocacy groups came together to make existing units or building conversions available for people living in shelters. The initiative moved hundreds of people from shelter to permanent housing, freed up shelter space for individuals and families in crisis and reduced strain across the homelessness response system.
Read the report below to learn how the initiative took shape, hear perspectives from those closest to the work and explore results as of day 500.
A Dramatic Change, In 500 Days
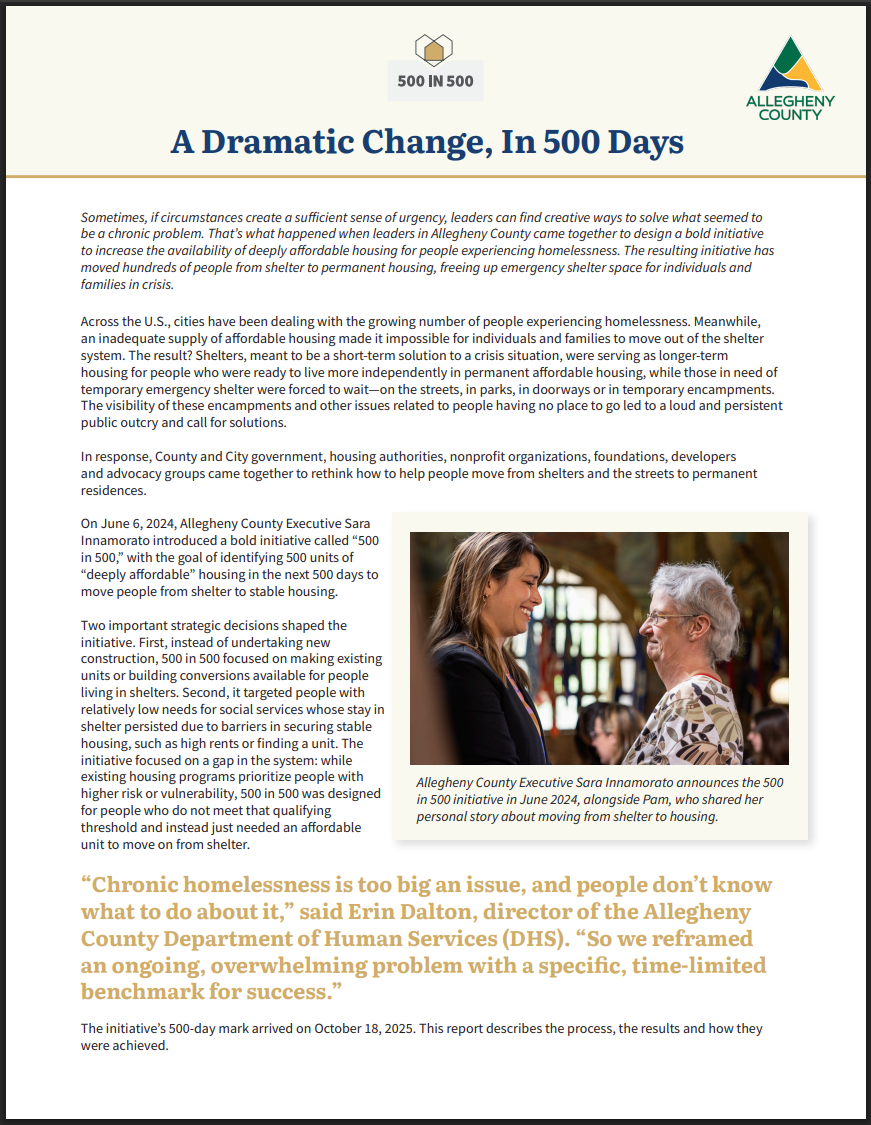
Sometimes, if circumstances create a sufficient sense of urgency, leaders can find creative ways to solve what seemed to be a chronic problem. That’s what happened when leaders in Allegheny County came together to design a bold initiative to increase the availability of deeply affordable housing for people experiencing homelessness. The resulting initiative has moved hundreds of people from shelter to permanent housing, freeing up emergency shelter space for individuals and families in crisis.
Across the U.S., cities have been dealing with the growing number of people experiencing homelessness. Meanwhile, an inadequate supply of affordable housing made it impossible for individuals and families to move out of the shelter system. The result? Shelters, meant to be a short-term solution to a crisis situation, were serving as longer-term housing for people who were ready to live more independently in permanent affordable housing, while those in need of temporary emergency shelter were forced to wait—on the streets, in parks, in doorways or in temporary encampments. The visibility of these encampments and other issues related to people having no place to go led to a loud and persistent public outcry and call for solutions.
In response, County and City government, housing authorities, nonprofit organizations, foundations, developers and advocacy groups came together to rethink how to help people move from shelters and the streets to permanent residences.
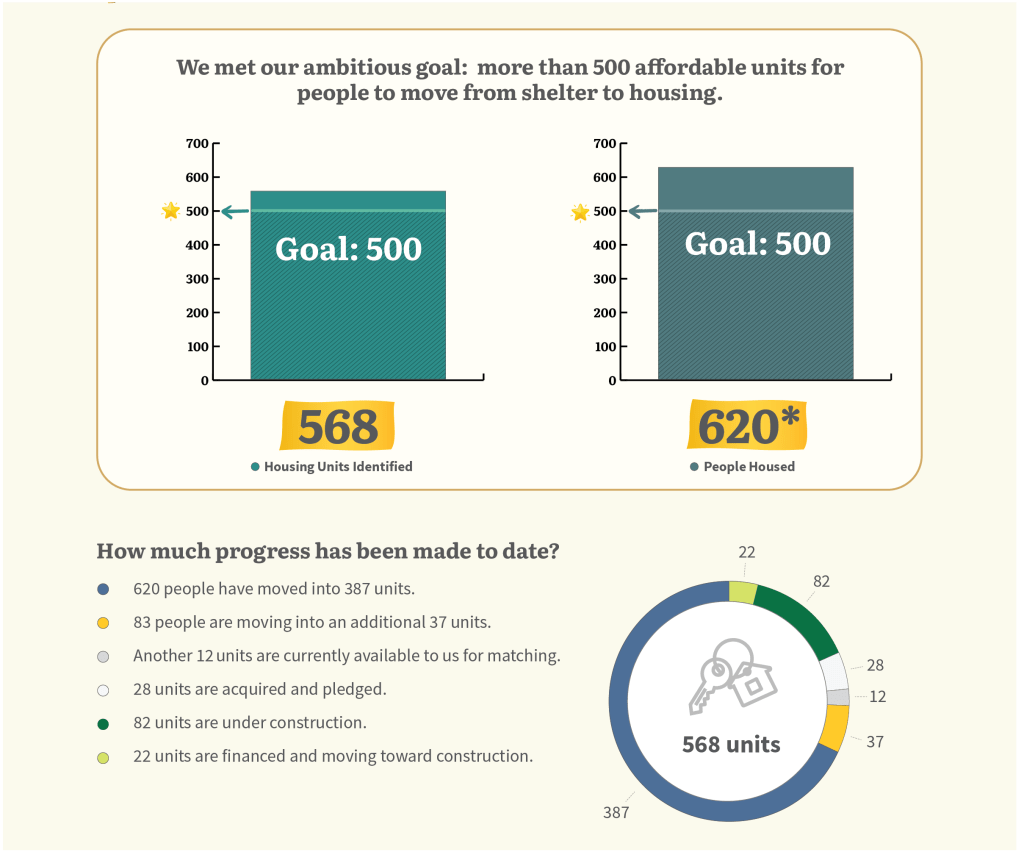
On June 6, 2024, Allegheny County Executive Sara Innamorato introduced a bold initiative called “500 in 500,” with the goal of identifying 500 units of “deeply affordable” housing in the next 500 days to move people from shelter to stable housing.
Allegheny County Executive Sara Innamorato announces the 500 in 500 initiative in June 2024, alongside Pam, who shared her personal story about moving from shelter to housing.
Two important strategic decisions shaped the initiative. First, instead of undertaking new construction, 500 in 500 focused on making existing units or building conversions available for people living in shelters. Second, it targeted people with relatively low needs for social services whose stay in shelter persisted due to barriers in securing stable housing, such as high rents or finding a unit. The initiative focused on a gap in the system: while existing housing programs prioritize people with higher risk or vulnerability, 500 in 500 was designed for people who do not meet that qualifying threshold and instead just needed an affordable unit to move on from shelter.
“Chronic homelessness is too big an issue, and people don’t know what to do about it,” said Erin Dalton, director of the Allegheny County Department of Human Services (DHS). “So we reframed an ongoing, overwhelming problem with a specific, time-limited benchmark for success.”
The initiative’s 500-day mark arrived on October 18, 2025. This report describes the process, the results and how they were achieved.
Formulating a strategy
Affordable housing was a high priority for Innamorato—and an issue she understood well. Having experienced housing instability as a teen, Innamorato prioritized housing policy issues long before becoming County Executive. She served on the board of the Allegheny County Housing Authority (ACHA), and as a State Representative introduced the landmark Whole Home Repairs Act in the state legislature. When elected to lead Allegheny County, Innamorato made it clear that affordable, accessible housing for everyone in Allegheny County was one of her signature priorities.
For Dalton, who managed DHS’s analytics work before becoming its director, everything starts with data. The most obvious data in this case were rising numbers of people on the streets and longer stays in shelters. But along with increasing need, Dalton also saw hopeful data on the supply side, in the form of the thousands of empty apartment units and subsidized housing vouchers available through the City and County housing authorities.
Debbie, a former teacher, in her new apartment with her dog Baxter. Debbie moved into her apartment in November 2024.
Public housing and voucher subsidies are in heavy demand, but Rich Stephenson, executive director of ACHA, knew one way to reduce the bottleneck. Since the moratorium on evictions during the COVID-19 pandemic ended, ACHA’s inventory of unoccupied units had grown because previous tenants, who had since been evicted, had left behind units that were uninhabitable.
“We had a substantial number of units with $5,000 to $15,000 of damage, mostly from families who had been living there for a long time and not paying rent,” Stephenson explained. “Because of our limited resources, we could not repair these units. Now, DHS needed these family units.”
Local developers also came to the table to dedicate units specifically for people coming from shelter. “The County Executive set a clear expectation that this was not business as usual,” explained Ed Nusser, Director of Housing Strategy for Allegheny County. “We leveraged the resources we had, telling developers that if they’re getting County support, we now expect some of their units to be available for people to move out of shelter. And the developers stepped up to be part of the solution.”
“The County Executive brought her political will and expertise to bear and coordinated many public- and private-sector players to align around solving this problem,” said Kendall Pelling, executive director of Rising Tide, a community organization with a focus on preserving affordable housing. “We have many projects that would not be happening today without 500 in 500.”
As the vision for 500 in 500 emerged, Allegheny County approached local foundation partners for help. Five area foundations stepped forward with a combined $3.4 million of assistance. While 500 in 500 didn’t have a budget, per se—part of the special sauce was that its success was mostly based on process improvements that didn’t cost money—this private support funded key parts of the initiative, including the rehabilitation of the housing authorities’ vacant rental units and supportive and case management services to assist housing recipients.
“Grantmaking is about investing in people you trust,” said Lauri Fink, senior program officer at Henry L. Hillman Foundation. “We have trust in the County Executive, Erin and County staff to find the best way forward.”
DHS expanded its own complement of staff helping people move from shelters to permanent housing and provided funding that enabled ACHA to hire six staff to provide supportive services to tenants. In addition, the authority used Urban Redevelopment Authority funds to purchase a 19-unit building on Pittsburgh’s North Side. The Housing Authority of the City of Pittsburgh (HACP) made project-based vouchers (which are attached to the unit, not the resident) available for 500 in 500 tenants moving into ACHA’s North Side location and other private developments.
Nate, age 65 years old, in his new apartment. Nate moved into his apartment in May of 2025.
HACP’s main procedural change involved setting aside both project-based and tenant-based vouchers for the 500 in 500 population. “What made this successful was that our staff interacted directly with the DHS caseworkers rather than the unhoused clients,” said Sauntee Turner, HACP government relations liaison. “They could collect all the needed documents for the application, so we just had to do background checks for eligibility. We got the process down from the usual 30 or 40 days to 11 days.”
The housing authorities also made vouchers portable across municipal lines—which was important, so that people could find an apartment in a neighborhood that worked for them.
Expediting the flow
Chuck Keenan, an administrator in DHS’s Office of Community Services, saw firsthand the challenges shelter staff faced in helping clients move into permanent housing. Before the 500 in 500 initiative, an effort known as the Second Avenue Commons pilot revealed that shelter staff did not have a clear understanding of eligibility for Continuum of Care (CoC) programs or access to resources that identified viable alternative housing pathways.
DHS addressed these system gaps by sharing information and developing resources to build shared understanding, clarify housing pathways and strengthen alignment across partners. This positioned the County to take on the 500 in 500 initiative from a place of readiness.
With those earlier challenges addressed—and with more public housing units and vouchers coming online—the 500 in 500 goal began to sound achievable. However, success depended on the system’s ability to move people quickly and on whether housing units could remain available long enough to make a match.
Private landlords willing to rent to a 500 in 500 participant could not hold units open indefinitely. To balance timely placements with landlord needs, DHS asked landlords and ACHA to commit to holding a unit for 500 in 500 clients for up to 14 days. “We don’t want our clients to get demoralized by looking at a unit and then finding out it’s been taken,” Keenan explained. “If we can’t match anyone to the unit in two weeks, then they can offer it elsewhere.”
Landlords welcomed the arrangement because it often brought paying tenants quickly. But meeting the 14-day window required case managers to act quickly. When the initiative began, case managers had to physically scan spreadsheets to match potential occupants to units that met their eligibility and preferences.
To address this issue, DHS’s Chief Technology Officer Rachel Silver streamlined the process by constructing a detailed dashboard where participating landlords enter pertinent information about their unit, including location, number of bedrooms, any age requirement, access to public transit, what utilities are included, whether pets or smoking are permitted, and if they will accept tenants with a prior history of felonies or evictions. The dashboard already contains a master list of all public housing properties, so the housing authorities can simply check a box when a particular unit becomes open.
Thanks to this dashboard, case managers can go online, enter a client’s characteristics, and see all the available units that fit the search criteria. Or they can select an open unit, see all the prospective tenants whose criteria match it, and reserve it directly through the platform.
Brent Weinert, who helps individuals prepare for a housing placement, deeply appreciates the changes. “Doing subsidized housing applications takes a lot of paperwork,” he noted. Before 500 in 500, “you might do 20 applications in the hope that one might work.” Now, the dashboard and ACHA’s preference designation for people who have nowhere to live create a high percentage of success. Weinert said that in many cases, clients have been able to move from intake to a housing offer within 30 days.
Weinert’s team has grown to seven caseworkers who conduct housing assessments and develop permanent housing plans for clients who do not qualify for higher levels of supportive housing services.
One frequent obstacle to housing eligibility is that many applicants lack the documentation—birth certificate, social security card and ID card—that public housing authorities require. To resolve that bottleneck, DHS senior advisor Kathy McCauley recruited a team of eight part-time staff, including some DHS retirees with prior case management experience, who have so far helped 700 individuals assemble their documentation so that they are housing-ready. Because new shelter residents continually arrive, this project remains in place.
While Weinert works with single individuals, Remy Harris supervises a team assisting families. Although most families exit from shelter within six months, Harris has seen some stay for much longer—especially those facing housing barriers such as prior evictions, a criminal record, or owing money to a housing authority.
Along with the streamlined matching and application process, Harris credits the stronger relationship between DHS and the housing authorities, which includes weekly coordination meetings, with making her work easier.
“They know they can count on us, so they are more willing to take people coming from the shelter system in their units,” Harris said.
Support from 500 in 500 does not end when an individual or family moves into a home. A tenant support program, created two years ago, embraced the task of reaching out to 300 households during 2025; by October, they had already served 290. Program coordinators work with clients to develop a support plan that addresses tangible needs such as food, transportation, furniture and employment assistance. “I believe the most significant impact our team has made on our clients is not just resource linkage but providing support and reassurance that the client has the ability to maintain housing and to further pursue a life of stability and self-sufficiency,” said James Greer, tenant support program administrator.
Treating people in tents with dignity
Few people support tent cities in downtown areas, but just as few support callous emptying of encampments where unhoused people have placed their scant possessions. 500 in 500 offered a different approach to this vexing problem.
Muhammad Ali Nasir (better known as Man-E) played a key role. Man-E founded an outreach program for current and former jail residents that expanded into homeless outreach in 2022 and later became part of 1Hood Media. In this role, he met with City and County leaders, insisting that before they cleaned out any encampments, they needed to give residents a viable place to go.
Man-E had been involved from start to finish with a 40-tent encampment that popped up along the Eliza Furnace Trail near downtown. “I gave the first tent to someone living there,” he said. “They’d been kicked out of a shelter. If they were going to shut down the encampment, we wanted it to happen in a dignified way.”
That’s exactly what happened in fall 2024, when the County, City, outreach workers and advocates worked together to move people inside. Man-E and other outreach workers compiled a list of the encampment residents, their living situation (i.e., whether they had a partner, a pet, or other needs) and what housing they would accept. As a placement was identified for each, Man-E helped transport their belongings to the new location. Only then was the tent marked as vacant and ready for removal.
Contrary to popular assumptions, Man-E said the majority of encampment residents were there for financial reasons, not due to mental health or substance use issues. Some had been released from jail with no local family or social support. All were happy to move into housing options that worked for them, including scattered site shelters, bridge programs and permanent housing.
“I did not always trust DHS or City government before this project,” Man-E acknowledged. “Now that I have worked closely with them to eradicate homelessness, I have seen the fruits of their labor.”
Lisa Frank, former chief operating and administrative officer for the City of Pittsburgh, highlighted the impact of 500 in 500 in enabling city government to offer a credible alternative to living unsheltered.
“People can come into a shelter through the front door, but they have to have a back door so that they can leave shelter and be properly housed,” Frank stated. “A congregate shelter with minimal privacy is not how people want to live. A lot of people won’t want to come in from the cold if they think they will end up on the top bunk in a room of 30 people for the next 365 days. With the focus on housing, we create flow in our system. Now, if someone puts up a tent, outreach workers can go out and tell them that this is not a safe place to live but that we can help them find one.
“Unhoused people can see, just like everyone else, what’s working or not working,” Frank added. “When they learn that their friends are finding credible alternatives to living alongside a trail, that changes the conversation. 500 in 500 has made it possible for us to say to people living outside, ‘Come to our shelter and we can work from there.'”
Results as of Day 500
Quantitatively, there’s no question that 500 in 500 has been a success. As of day 500 (October 18, 2025):
Forty-nine percent (273) of the units were in the private market, forty-one percent (228) were from a housing authority and the remaining 9% (52) were supportive housing.
Two hundred forty-four adults, including many who are 55+, and 102 families with children have secured housing. Most families with children had a household size of two to four people, but the initiative has found housing for families with as many as eight members.
Among single adults, the average number of exits to rental units increased 35%, from about 20 per month in the year preceding the initiative to an average of 27 per month during the initiative.
As of early November 2025, 98% of families with children and 95% of adults who leased a unit through 500 in 500 had not returned to the homelessness system.
The total number of tents along the riverfront trails and in downtown Pittsburgh reached a high of 143 on August 20, 2024; that number stood at two as of the end of October.
Northside Riverfront Trail, 2024
Northside Riverfront Trail, 2025
When the County set out to quickly house individuals staying in shelter who were assessed as relatively low-risk, they relied on a predictive risk model—the same model used to identify those eligible for permanent supportive housing. Allegheny County DHS is one of only a few governments in the world using predictive analytics to target interventions. Most systems still depend on manual, time-consuming assessment tools that are less accurate and often reinforce bias. Those approaches result in the less precise identification of target populations, thus diluting the impact of interventions. In contrast, DHS’s models have repeatedly proven to be more accurate than traditional methods and to reduce racial disparities in outcomes. This data-driven precision is a key reason for the success of 500 in 500.
Among over 400 people who leased through 500 in 500 through June 2025:
Only 6% subsequently experienced a mental health crisis
A remarkably low 1% had a mental health inpatient stay
Only 4% had more than four emergency department visits (compared with over 40% for their high-risk peers staying in shelter)
Only 1% had a booking in the County Jail
Qualitatively, participants and stakeholders have expressed appreciation for the quality and efficiency of service; the fruitful collaboration between DHS and the City and County housing authorities; the inclusion of a broad range of stakeholders concerned about the attractiveness of downtown Pittsburgh; and the innovation and decency with which Pittsburgh and Allegheny County have tackled the vexing problems of homelessness and tent encampments.
“It was a privilege to be invited to the 500 in 500 table early on,” said Matt Galluzzo, president and CEO of Riverlife. “Erin Dalton and DHS have done a brilliant job of using data to understand the problem better, advance solutions, and set an audacious goal to get the system working as it should. I commend the City and County for approaching this problem in an appropriate and dignified way. This is a great example of Pittsburghers understanding our community and rallying to support those in need.”
“It is exciting to see so many City and County departments come together to work toward the same end goal,” said Fink of Henry L. Hillman Foundation.
“500 in 500 has succeeded in getting everyone focused on moving people into housing.”
Chuck Rohrer, HACP communications director, echoed Fink’s sentiments: “The interagency cooperation is much better than before. It’s nice to see that Pittsburgh can pull together and achieve such an ambitious goal.”
“I could never have imagined a government office operating with this speed and agility, especially while relying on in-house expertise,” said Silver, the DHS technology officer. “Peers at other levels of government are often surprised by how quickly we can move and how much we do in-house.”
For ACHA’s Stephenson, the chance to deploy his agency’s resources with greater effectiveness has been rejuvenating. “This partnership is not going to end on the 500th day,” he declared. “It will absolutely continue as long as I am sitting here.”
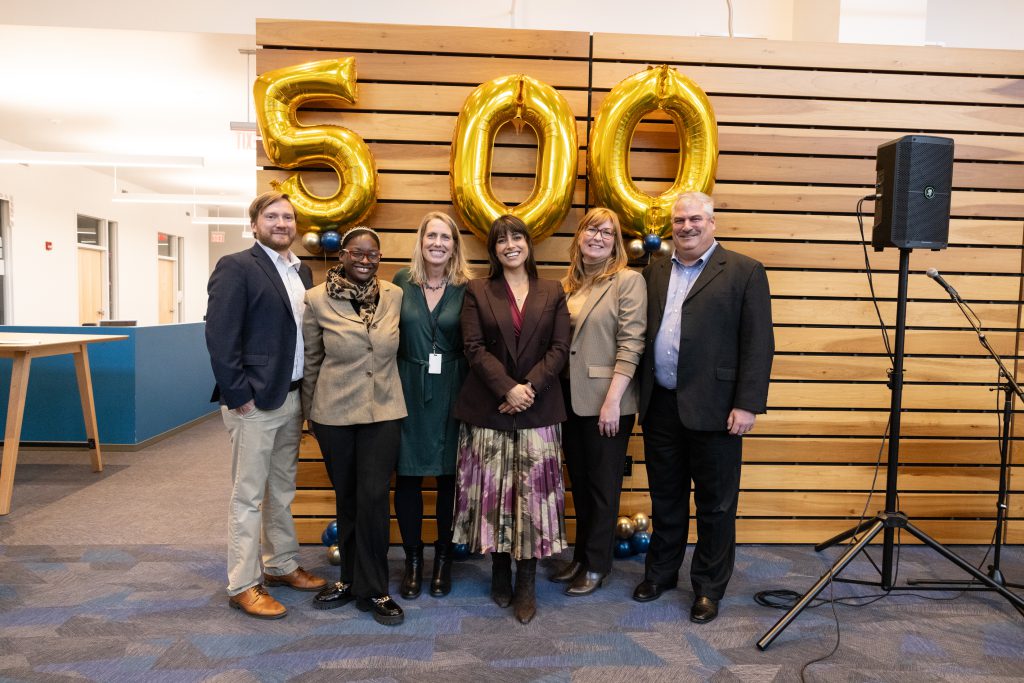
The Allegheny County team celebrating day 500. Left to right: Ed Nusser, Director of Housing Strategy; Andrea Johnson, 500 in 500 participant; Erin Dalton, Director of Human Services; Sara Innamorato, County Executive; Lauren Connelly, Director Economic Development; Rich Stephenson, Director of Allegheny County Housing Authority.
County Executive Innamorato said, “I’m thrilled with the success of 500 in 500. Not only did we exceed our goals in terms of identifying units and housing people, we forged new partnerships and changed systems that will continue to provide lasting benefits well past day 500.”
Thank You to Our Partners
Government Partners
Allegheny County Department of Human Services
Allegheny County Economic Development
Allegheny County Housing Authority / Glenshaw Gardens
City of Pittsburgh
Housing Authority of the City of Pittsburgh
PA Housing Finance Agency
Urban Redevelopment Authority of Pittsburgh
Property Owners
Action Housing
Baltic Steel Management
Brandywine Communities
Clairton Community Properties
Hullett Properties
MS Capital Group Pittsburgh LLC
NDC Asset Management
Rising Tide Partners
Trek Development
Foundations
Buhl Foundation
Eden Hall Foundation
The Heinz Endowments
Henry L. Hillman Foundation
Richard King Mellon Foundation
Download Full Report (PDF, 150 MB)
Questions or Feedback?
We welcome your questions and suggestions. To share feedback, you can reach us at DHSResearch@alleghenycounty.us. If you’d like to stay informed, consider signing up for our newsletter. To learn how to use DHS data in your research, please visit our Requesting Data page. Thank you for your time and interest. Your engagement helps shape and improve how we share data that matters.
The Alternative Response Initiative provides emergency intervention by trained behavioral health and social services professionals instead of—or in addition to—police or EMS for eligible 9-1-1 calls. During non-violent crises, these professionals offer de-escalation, support and connections to resources. The program aims to (1) reduce strain by strengthening emergency capacity and (2) deliver trauma-informed, client-directed and compassionate responses, positioning the emergency response network to serve the public promptly, efficiently, thoughtfully and effectively.
DHS invites you to explore this page and the interactive dashboard to learn about the Alternative Response Initiative.
Home functions as the entry point to the dashboard, outlining the program’s purpose and orienting users to the focus of each tab.
About the Program describes the Alternative Response Initiative, outlining the program’s goals, operations and service regions.
About the Data identifies the data sources used in this collection of dashboards and clarifies what information each source provides.
Engagement Pathways details response types, illustrates sequence of actions and interactions across the response network from start to finish, and provides explanations for frequently asked questions regarding program protocols and practices.
Requests and Responses is an interactive tab that displays call volume over time, response types, call types and time spent at each step.
Interventions and Outcomes is an interactive tab that displays metrics on interventions teams provide, how situations resolve and the outcomes that follow.
Demographics and Client Volume is an interactive tab that visualizes call volume over time and allows users to examine differences in demographic groups.
The dashboard updates monthly and presents data since October 15, 2024—the start of the Alternative Response Pilot program.
How the County Uses this Information
The county uses this information to:
Track emergency response needs across communities over time to understand shifts in demand.
Identify disparities in access and engagement to ensure the program meets residents where they are, equitably.
Make data-driven decisions in practices and policies that align with observed community needs.
Strengthen transparency and build shared understandingof the program for Allegheny County residents.
For the best experience, we encourage exploring the dashboard on its full site. You can view it directly here.
Questions or Feedback?
We welcome your questions and suggestions. To share feedback, you can reach us at DHSResearch@alleghenycounty.us. If you’d like to stay informed, consider signing up for our newsletter. To learn how to use DHS data in your research, please visit our Requesting Data page. Thank you for your time and interest. Your engagement helps shape and improve how we share data that matters.
Youth involvement in the juvenile justice system is complex and varies over time and across communities. Access to localized data on youth referrals is crucial for understanding factors that drive system involvement and for making informed decisions that support thoughtful and effective policies and practices in our communities.
With funding from the FISA Foundation, this dashboard promotes transparency and informed learning. We invite you to explore the Juvenile Justice Offenses Dashboard to understand patterns in youth referrals across Allegheny County.
Home introduces the dashboard by presenting the scope of the data and highlighting the primary measures available for users to explore.
Data and Definitions provides the foundational context needed to interpret the visualizations by defining key terms, describing the data sources, outlining the date range and noting the privacy protections applied to the dashboard.
Summary is an interactive tab where users can explore the distribution of referred youth by demographics (race, sex, age) and offense types. This section also offers filters to compare groups and identify shifts over time.
Neighborhood is an interactive tab that displays number of referrals by neighborhood or municipality and offers the distribution of referrals across offense types. This tab enables users to explore geographic patterns and filter data by key measures to see how patterns in youth referrals vary across the County.
These data describe trends in youth referrals and are indicators of system involvement—not prevalence of all youth behavior.
How the County Uses this Information
The county uses this information to:
Monitor trends in alleged youth offenses and spot emerging patterns in youth referrals.
Shape programming and target support for communities and youth with the greatest needs.
Make data-informed decisions that guide planning, funding and improvement efforts that best meet public needs.
Promote transparency and build shared understandingaround juvenile justice referrals in Allegheny County.
For the best experience, we encourage exploring the dashboard on its full site. You can view it directly here.
Questions or Feedback?
We welcome your questions and suggestions. To share feedback, you can reach us at DHSResearch@alleghenycounty.us. If you’d like to stay informed, consider signing up for our newsletter. To learn how to use DHS data in your research, please visit our Requesting Data page. Thank you for your time and interest. Your engagement helps shape and improve how we share data that matters.
Allegheny County’s Department of Human Service is responsible for providing and/or overseeing publicly funded mental health and substance use services. The majority of behavioral health funding for Allegheny County flows through the HealthChoices Program (Medicaid dollars), though the County provides additional base funding to cover treatment services for un- and under-insured individuals and for services not covered by Medicaid (e.g., supportive housing). Funded services aim to effectively address both immediate and long-term behavioral health needs for children, youth, adults and families facing challenges related to mental health and/or substance use diagnoses. DHS invites you to review this page and its related content to learn about utilization of behavioral health services in Allegheny County.
Dashboard Content
The Publicly Funded Behavioral Health Services Dashboard presents data on client demographics, diagnoses, types of services, providers and costs associated with behavioral health service use. This dashboard has four tabs:
Homepage describes the organizational structure of behavioral health services, identifies the goals of such services, defines the scope of the dashboard contents and reveals the value in understanding behavioral health service use.
About this Dashboard builds upon the information introduced on the homepage—offering increased details on data sources, funding streams, types of services and organizational relationships that shape Allegheny County’s behavioral health system.
Client Summary is an interactive tab where users can explore service engagement over time by analyzing demographics, service categories and diagnoses with options to filter data by funders, providers and levels of service.
Cost Summary is an interactive tab that displays trends in costs for fee for service behavioral health service claims. Users can filter data by type of claim, payor, timeframe, providers and levels of service; users can adjust views to display data by service categories, diagnoses, units and/or costs.
The dashboard updates daily and covers data from January 1, 2018 to the present, with a three-month reporting lag.
How the County Uses this Information
The county uses this dashboard to:
Monitor trends in behavioral health service use.
Identify disparities in service engagement across populations.
Make data-informed decisions that guide planning, funding and improvement efforts that best meet public needs.
Promote transparency and build shared understanding around use and costs of behavioral health services
Trouble viewing the dashboard below? You can view it directly here.
Questions or Feedback?
We welcome your questions and suggestions. To share feedback, you can reach us at DHSResearch@alleghenycounty.us. If you’d like to stay informed, consider signing up for our newsletter. To learn how to use DHS data in your research, please visit our Requesting Data page. Thank you for your time and interest. Your engagement helps shape and improve how we share data that matters.
DHS invites you to view this page to learn about Highland Detention Center —a part of the juvenile justice process. This center opened in July 2024 on the site of the former Shuman Detention Center, which closed in September 2021. Information is also available on youth detained at the former Shuman Detention Center from 2016 through its closure.
Home presents the purpose of the dashboard, provides context about youth detention and introduces the two main aspects of this dashboard: Highland Detention Center and the formerly known Shuman Detention Center.
Data and Definitions lists terms used across dashboard tabs and offers users context about the data.
Information About Program Involvement explains how the dashboard calculates program involvement in relation to detention events, defines the time windows used to measure involvement before detention and after release, and shows examples of how the dashboard applies those windows.
Highland Daily Census and Demographics is an interactive tab that displays instances of detention at Highland, providing daily counts and averages for stays, along with demographics by race, sex and age.
Highland Entries, Exits and Lengths of Stay is an interactive tab that provides data on admissions, releases and the time spent at Highland Detention Center for detained youth.
Highland Highest Open Charges is an interactive tab that displays types of charges and identifies whether youth had an open warrant or weapon involvement at admission to Highland Detention Center.
Pre-Detention Program Involvement is an interactive tab that summarizes youth involvement across human services, physical and behavioral health, public benefits and criminal justice systems within defined time windows prior to detention.
Post-Release Program Involvement is an interactive tab that summarizes youth involvement across human services, physical and behavioral health, public benefits and criminal justice systems within defined time windows following release from detention.
Shuman Daily Census and Demographics is an interactive tab that shows detention at Shuman prior to its closure, with daily counts and averages for stays and demographics by race, sex and age.
Shuman Entries, Exits and Lengths of Stay is an interactive tab that details how youth moved through Shuman prior to its closure, providing data on admissions, releases and time spent in detention.
How the County Uses this Information
DHS, their partners and the County as a whole use this dashboard to:
Monitor trends in youth detention at Highland Detention Center.
Promote transparency and build shared understanding around youth detention in Allegheny County.
For the best experience, we encourage exploring the dashboard on its full site. You can view it directly here.
Questions or Feedback?
We welcome your questions and suggestions. To share feedback, you can reach us at DHSResearch@alleghenycounty.us. If you’d like to stay informed, consider signing up for our newsletter. To learn how to use DHS data in your research, please visit our Requesting Data page. Thank you for your time and interest. Your engagement helps shape and improve how we share data that matters.
We invite you to view this page and the Substance Monitoring Interactive Dashboard to learn about substance use in Allegheny County.
Background
Traditional data to track substance use—such as hospital records, medical claims and overdose fatalities—are delayed and incomplete. These methods also miss the emergence of new substances in communities. To close these gaps in knowledge and service engagement, Allegheny County partners with Prevention Point Pittsburgh and the UNC Street Drug Analysis Lab to provide drug checking ⓘ and Biobot for wastewater surveillance. ⓘ
By combining data on wastewater analysis and drug checking results, Allegheny County has an increased understanding of local trends in the drug supply and in volume of substance use. This information, coupled with the more traditional data on substance use, helps the County make data-informed decisions that enhance the timeliness and effectiveness of substance use prevention, intervention and treatment efforts.
Homepage: The Homepage presents the purpose of the dashboard, outlines the gaps in substance use monitoring, and introduces the two core data sources for this dashboard: wastewater analysis and drug checking results.
Wastewater Surveillance Data is an interactive tab where users can filter by type of high-risk substance, track its presence in wastewater over time, and compare local, regional and national findings.
PPP Drug Checking Results is an interactive tab that allows users to select substances of interest, adjust timeframes, and compare suspected and actual sample contents.
About Wastewater Data details the collection and testing process conducted by Allegheny County Sanitary Authority (ALCOSAN) and Bibot, defines parent drugs and metabolites, and includes a brief glossary of some high-risk substances.
About Drug PPP Checking defines drug checking, describes how Prevention Point Pittsburgh and the UNC Street Drug Analysis Lab collaborate and states the value drug checking provides the community.
Wastewater Download View is a tab that lets users view and download data on the effective concentration for high-risk substances in wastewater, with filters for substance name, drug type, region and date range.
The data contained in this dashboard serves as indicators of broad trends and emerging risks in the community rather than exact prevalence rates in substance use.
How the County Uses this Information
DHS and its partners use the dashboard to:
Monitor substance use trends in Allegheny County.
Supplement traditional data sources to fill gaps in drug tracking.
Identify emerging risks and make informed adjustments to outreach efforts.
Coordinate with agencies and providers to deliver timely, targeted harm reduction interventions.
Compare local data with broader contexts to guide planning and resource allocation.
Trouble viewing the dashboard below? You can view it directly here.
Questions or Feedback?
We welcome your questions and suggestions. To share feedback, you can reach us at DHSResearch@alleghenycounty.us. If you’d like to stay informed, consider signing up for our newsletter. To learn how to use DHS data in your research, please visit our Requesting Data page. Thank you for your time and interest. Your engagement helps shape and improve how we share data that matters.
Since 2022, the Allegheny County Jail Oversight Board (JOB) has approved monthly disbursements of $125 to individuals in custody from the Incarcerated Individuals Welfare Fund (IIWF). In 2024, the IIWF program provided more than $2.6 million to over 6,000 accounts for incarcerated individuals. These payments provide individuals in custody with funds that can cover expenses for phone calls, tablet use, commissary items and legal fess (e.g., fines, bail). Recipients can also save funds for use after release.
In January 2025, the JOB asked DHS to provide a descriptive analysis of the IIWF’s recipients and their use of the funds to inform future disbursement of the IIWF. Review the report to learn more about the IIWF—including who receives funds, how recipients spend funds and what impact the funds have on individuals’ outcomes post release.
Key Takeaways
Reach
Sixty-three percent of people in the ACJ in 2024 received at least one $125 payment from the IIWF during their stay. If the JOB were to disburse money more than one time a month, more people in the jail would benefit from receiving it.
Reliance
1 in 5 IIWF recipients did not receive any other deposits in their account, underscoring the importance of the IIWF for individuals in custody who do not receive funds from families and friends outside the jail.
Spending Patterns
External deposits (from friends and family) did not decrease with the onset of the IIWF.
For individuals who received funds in their first month at the ACJ, the IIWF lead to an increase in spending in every category of purchase—especially on commissary items.
Balance at Release
Among Individuals in the ACJ for one month or less
The median balance of IIWF recipients at release was $105 more than individuals who did not receive payments through IIWF.
IIWF recipients were almost 5x more likely to have a balance over $50 at release than non-recipients.
Among long stayers (individuals who stayed more than a month in jail):
After the implementation of the IIWF, the median balance at release grew from $4 to $60 and the share of individuals leaving the jail with at least $10 rose from 45% to 76%.
Post-Release Outcomes
Short-term outcomes—such as rebooking, emergency room use, shelter use, street homelessness—were not significantly different between individuals who left the ACJ with more than $75 and those who had no funds at release.
Questions or Feedback?
We welcome your questions and suggestions. To share feedback, you can reach us at DHSResearch@alleghenycounty.us. If you’d like to stay informed, consider signing up for our newsletter. To learn how to use DHS data in your research, please visit our Requesting Data page. Thank you for your time and interest. Your engagement helps shape and improve how we share data that matters.
Parental overdose fatalities have adverse and lasting effects on children’s mental health – heightening the risk of depression, anxiety, post-traumatic stress disorder and suicide. However, there are no federal or state data systems currently link parental overdose deaths to their children, limiting our ability to understand outcomes for this group and provide timely, targeted support as needed.
This report presents insights drawn from Allegheny County’s integrated data system, which links parents to children and allows us to examine service involvement overtime. We find high rates of service involvement that are related to parent’s long histories with substance use. This includes high rates of parental child welfare involvement in the years prior to their overdoses, histories of non-fatal overdoses and high rates of criminal justice system involvement. For children, we find decreasing interaction with child welfare and no increase in justice or crisis behavioral health system interaction for childrenand youth after parental death. Children and youth do experience increases in outpatient mental health care in the 9 months following parental death, fallingand returning to baseline within 18 months—demonstrating the resilience of these children and youth.
Key Takeaways
Scope
From 2016-2023, there were 1,694 parents who died of an overdose, leaving behind more than 3,500 children – an average of 447 children per year.
Demographics of the Children
The most common age group at the time of parental overdose was 13-17 (25%), but half were under 13 at the time of their parent’s death and 14% (503) were under five.
Although most of the children (63%, 2,223) were White, Black children disproportionately lost their parents.
Parent’s System Involvement
Although most had no child welfare involvement at the time of death, many had prior contact, with most first entering the child welfare system more than four years before the fatal overdose. Child welfare is a sign of broader high-risk behavior but is not temporally correlated to a fatal overdose.
Most of the parents were heavily connected to other systems and there is evidence of challenges with substance abuse for many years prior to the death.
More than half of parents received substance abuse treatment services in the 12 months before their death.
A quarter had a prior non-fatal overdose, with more than half having one in the 12 months before their death.
Seventy percent had a prior jail booking and more than quarter had one in the year before their death.
One in 5 used an emergency homeless shelter or were involved with street outreach in the past.
Children’s Service Involvement
We do not find evidence of long-term increased system interaction post parental death
Most children had no connection to human services in the year before or after their parent’s death, and interaction with most services stayed consistent pre- and post-death.
The rate of involvement in child welfare fell by almost 30% in the 3 years after parental death compared to the 3 years before.
About 5% of youth were involved with the juvenile justice system each month, with no increase in the three years after parental death.
The exception is in mental health outpatient treatment services. Compared to other Medicaid-enrolled children and youth, this group used these services at more than double the rate before and after their parents death.
We observe an increase in involvement in the nine months after their parents death, suggesting that children and youth receive increased support in the immediate aftermath of their parents death.
After 9 months, involvement returns to ‘pre-death’ levels, suggesting that this increased need may not persist long-term
How DHS Uses This Information
DHS uses these data to:
use public funding — such as opioid settlement funds — responsibly and equitably to provide care and support to those most in need.
strengthen intervention strategies aimed at supporting the wellbeing of children and families.
promote transparency and build shared understanding around child bereavement and parental overdose fatalities.
surface a critical gap—linking parental overdoses to bereaved children — in human service work and systems.
What’s Next
Allegheny County will receive annual installments of opioid settlement funds (OSF) through 2038. Settlement dollars augment annual HealthChoices and Block Grant funds for behavioral health treatment and supports to help county residents. These are the current and upcoming ways DHS plans to use investments and collaborate with community partners to prevent and reduce substance use harm and fatalities in the community:
Expanding Early Head-Start Child Care for children impacted by substance use
Launching a County-wide campaign to promote safe medication storage and offer guidance on naloxone (Narcan) use for households with small children
Improving school-based assistance for children impacted by substance use
Increasing medication for opioid use disorder (MOUD) availability, including in the Allegheny County jail
Creating warm handoffs to treatment from emergency departments, to facilitate rapid referrals to treatment for patients with SUD.
Testing innovative strategies, such as contingency management (i.e., offering rewards when individuals achieve specific milestones or behaviors related to recovery), for stimulant addiction (e.g., cocaine, methamphetamine)
Gathering continued input from the community to identify the most effective ways to support families and children affected by overdoses
These current and upcoming efforts aim to deepen DHS’s understanding of community needs and ensure the use of public funds strengthen community wellbeing.
Questions or Feedback?
We welcome your questions and suggestions. To share feedback, you can reach us at DHSResearch@alleghenycounty.us. If you’d like to stay informed, consider signing up for our newsletter. To learn how to use DHS data in your research, please visit our Requesting Data page. Thank you for your time and interest. Your engagement helps shape and improve how we share data that matters.
Across the United States, homeless Continuums of Care are observing increasing rates of older adults experiencing homelessness. This brief examines these trends in Allegheny County, PA, where the share of the population age 65 and older is rising.
What is this report about?
In this brief, we looked at trends in older adults (age 65+) using emergency adult-only emergency shelters over the last decade (2015 through 2024), including their demographics, lengths of stay and exit destinations compared to other adults using shelter.
What are the takeaways?
The number of older adults in shelter more than tripled between 2015 and 2024 (from 58 to 191 clients), but they still comprise a small percentage of the overall adult shelter population. In 2024, the proportion of older adults in shelter was 7%.
From 2015 through 2024, 74% (N=611) of older adults using adult-only emergency shelter were men, but over the course of the decade, the share of older adult women using shelter has increased as the share of older adult men has decreased.
Forty-two percent of older adults using shelter in 2024 were Black, indicating disparity even among older adults in poverty; in 2023, Black individuals made up 17% of older adults in poverty in Allegheny County.
Since 2019, older adults exiting year-round emergency shelter stayed longer than adults age 18 through 64. However, older adults’ median length of stay has declined greatly after peaking in 2021.
More than 60% of older adults had just a single stay in year-round shelter over the decade; about 3% stayed more than five times.
Older adults were more likely than adults under age 65 to exit shelter to a housing unit with an ongoing subsidy, likely due to the higher number of specially designated federally assisted units available to these individuals.
How is this report being used?
This report provides insight into current and future housing support needs for older adults, information DHS can use to create new or enhance existing supports for older adults experiencing housing instability or homelessness.
Questions or Feedback?
We welcome your questions and suggestions. To share feedback, you can reach us at DHSResearch@alleghenycounty.us. If you’d like to stay informed, consider signing up for our newsletter. To learn how to use DHS data in your research, please visit our Requesting Data page. Thank you for your time and interest. Your engagement helps shape and improve how we share data that matters.
The Allegheny County Department of Human Services (DHS) regularly collects feedback from community members who use DHS and DHS-funded programs. Collecting and using this feedbackdemonstrates a commitment to continuous quality improvement, increasing trust among service users. DHS also administers broad-scale research surveys that gather data to help the Department conduct rigorous program evaluations. Recognizing the time and effort required for clients to participate in these activities, and the value of having higher, representative response rates, DHS has a standard practice of providing monetary incentives.
Key Takeaways
Thedata brief discusses the challenges of and solutions to scaling monetary incentives at large organizations, and it provides summary analytics about DHS’s incentive spending from Fall 2020 through December 2024.
In Fall 2022, DHS invested in two key partnerships, including a digital gift card platform, that has resulted in collecting more client feedback and human subjects research than ever before.
From 2020 to 2023, the number of clients who were given a gift card for their participation in data collection increased by nearly one order of magnitude each year.
Offering incentives increased participation rates, improved sample representativeness, and reduced the amount of staff time needed for data collection.
While incentives encourage participation with research activities, gift card redemption is largely influenced by the gift card amount; only 21% of gift cards $5 or less are redeemed while 91% of gift cards $30 or more are redeemed.
The top 3 brands for which participants choose to redeem their digital gift cards are Amazon (29.8%), Mastercard (9.5%) and Visa (9.2%).
Why This Matters and What’s Next
Client feedback helps DHS and its providers identify what services are working well and what are not meeting clients’ needs. Offering incentives increases participation rates, and higher participation rates lead to a more representative dataset to inform public policy decisions.Using technology-based business processes to collect data and process incentives allows DHS to do this at scale across nearly 500 contracted providers and over 200,000 clients served annually. Having extensive and robust feedback from the public ensures that residents are active partners in shaping service systems — and that those service systems are responsive, equitable and reflect the needs and priorities of the community.
Questions or Feedback?
We welcome your questions and suggestions. To share feedback, you can reach us at DHSResearch@alleghenycounty.us. If you’d like to stay informed, consider signing up for our newsletter. To learn how to use DHS data in your research, please visit our Requesting Data page. Thank you for your time and interest. Your engagement helps shape and improve how we share data that matters.